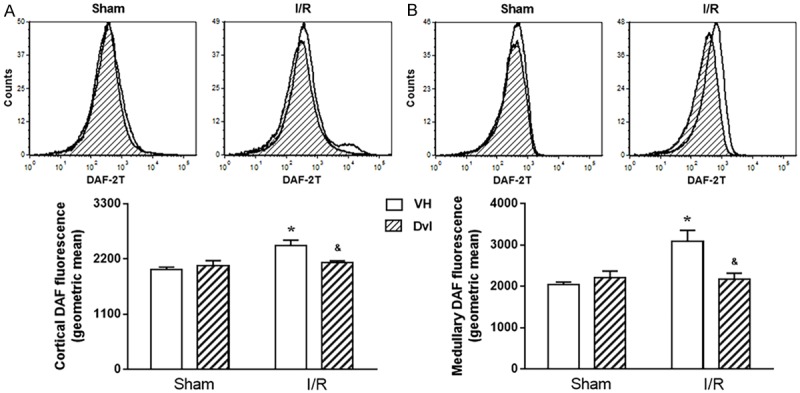
Figure 6.

Effects of Dvl on renal production of nitric oxide. Renal cortical (A) and medullary (B) production of nitric oxide. The top panel demonstrates representative histograms from flow cytometric analysis using 4,5-diaminofluorescein-2/diacetate (DAF), and the bottom panel shows the quantification of intracellular nitric oxide production in sham and IR animals treated with vehicle or Dvl in all studied groups. In both renal cortex and medulla, IR VH animals presented an increase in DAF fluorescence, and Dvl intravenous injection prior to IR resulted in a reduction of nitric oxide production. N=5-6. Values are means ± SEM. *p<0.05 vs. sham group; &p<0.05 vs. I/R VH. Two-way ANOVA followed by Tukey’s post hoc test.
