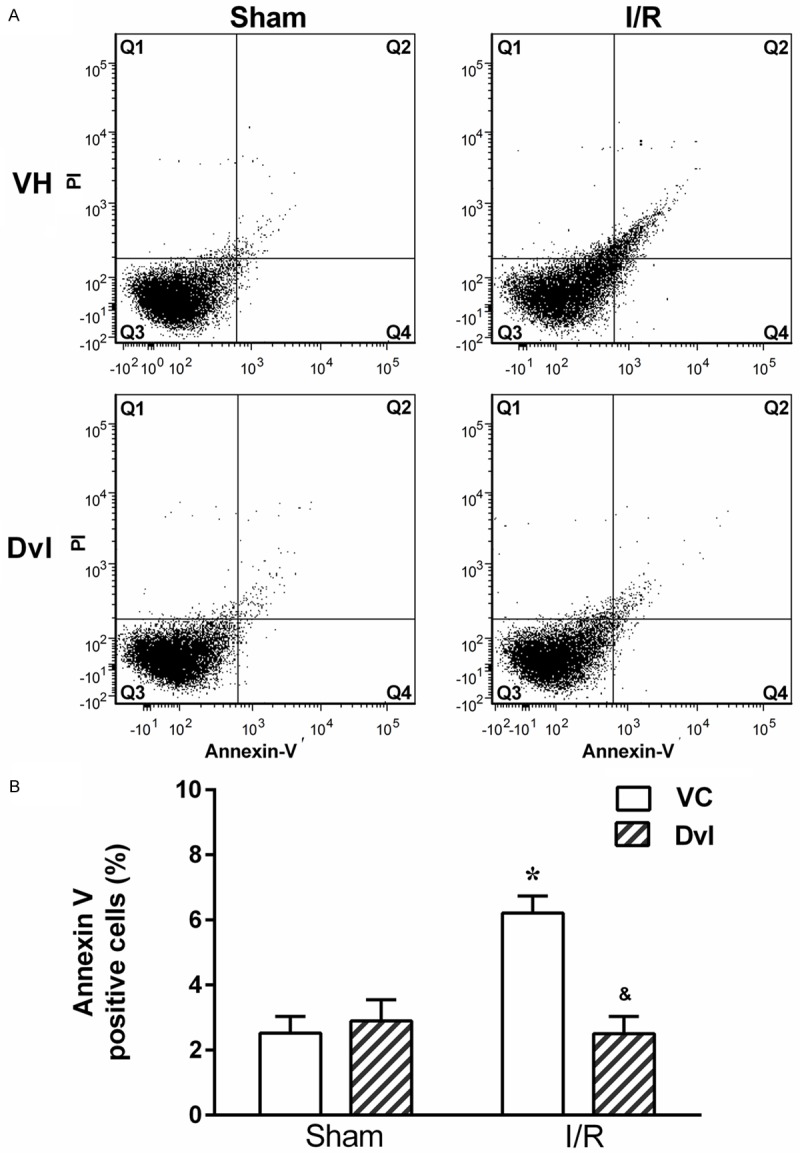
Figure 8.

Flow cytometry detection of apoptosis. A. Representative dot plot of Annexin-V and PI flow cytometry for kidney cells. Top left quadrant (Q1) shows damaged cells (Annexin V-/PI+); top right quadrant (Q2) contains cells in late apoptosis or already dead (Annexin V+/PI+); bottom left quadrant (Q3) shows viable cells (Annexin V-/PI-); bottom right quadrant (Q4) represents cells that are in early apoptosis (Annexin V+/PI-). Note an increase in the apoptotic cell number in vehicle-treated IR animals, which is significantly reduced in the Dvl-treated IR group. B. Bar graphs showing the average percentage of renal apoptotic cells (Q2+Q4) in vehicle- (white bars) and Dvl- (cross-hatched bars) treated sham and IR animals. N=4-6. Values are means ± SEM. *p<0.05 vs. sham group; &p<0.05 vs. IR VH. Two-way ANOVA followed by Tukey’s post hoc test.
