
Figure 4.
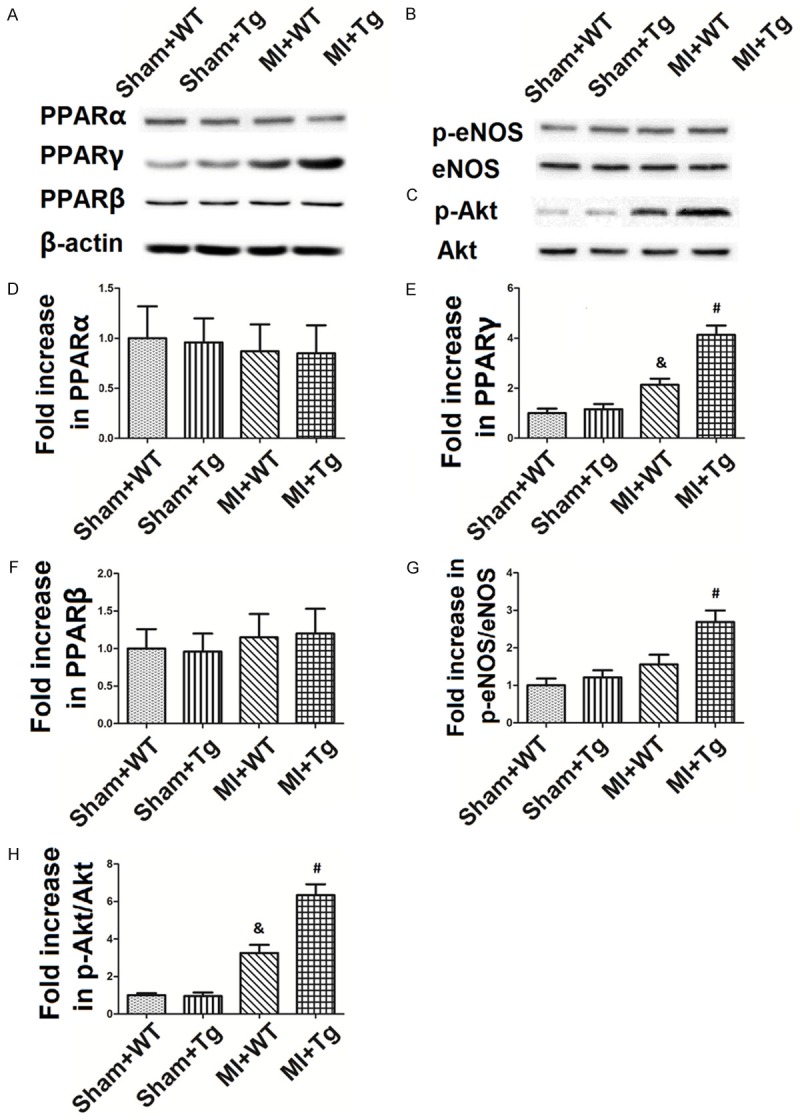
Changes in PPARα, PPARγ and PPARβ expression, eNOS and Akt phosphorylation. The blots of PPARα, PPARγ and PPARβ expression, eNOS and Akt phosphorylation are shown in (A-C), while the value changes are shown in (D-H). The values are expressed as Mean ± SD. &p<0.05 compared to the Sham+WT; #p<0.05 compared to the MIR+WT. N = 8 per group.