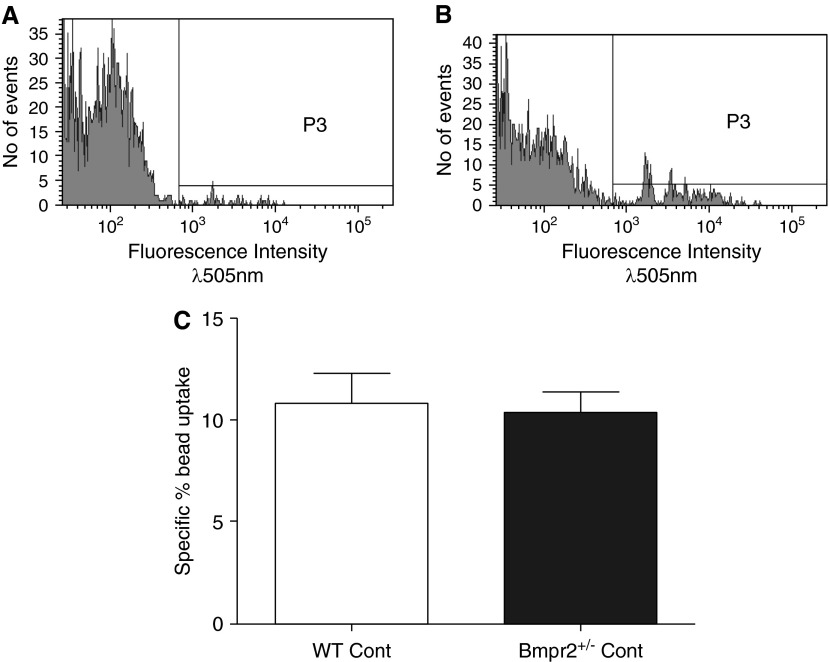
Figure 3.
(A, B) Plots showing fluorescence of macrophages cultured with fluorescently tagged beads for 2 hours at 4°C (P3) (control) (A) and macrophages cultured with fluorescently tagged beads for 2 hours at 37°C (P3) (experimental) (B). (C) Bar chart showing percentage of specific bead uptake in macrophages from wild-type (WT) and Bmpr2+/− control mice, calculated as fluorescence at 37°C (P3) − fluorescence at 4°C (P3). Graph shows mean ± SEM of four individual experiments. Bmpr2 = bone morphogenetic protein type 2 receptor; Cont = control; P3 = fluorescence intensity above background.

