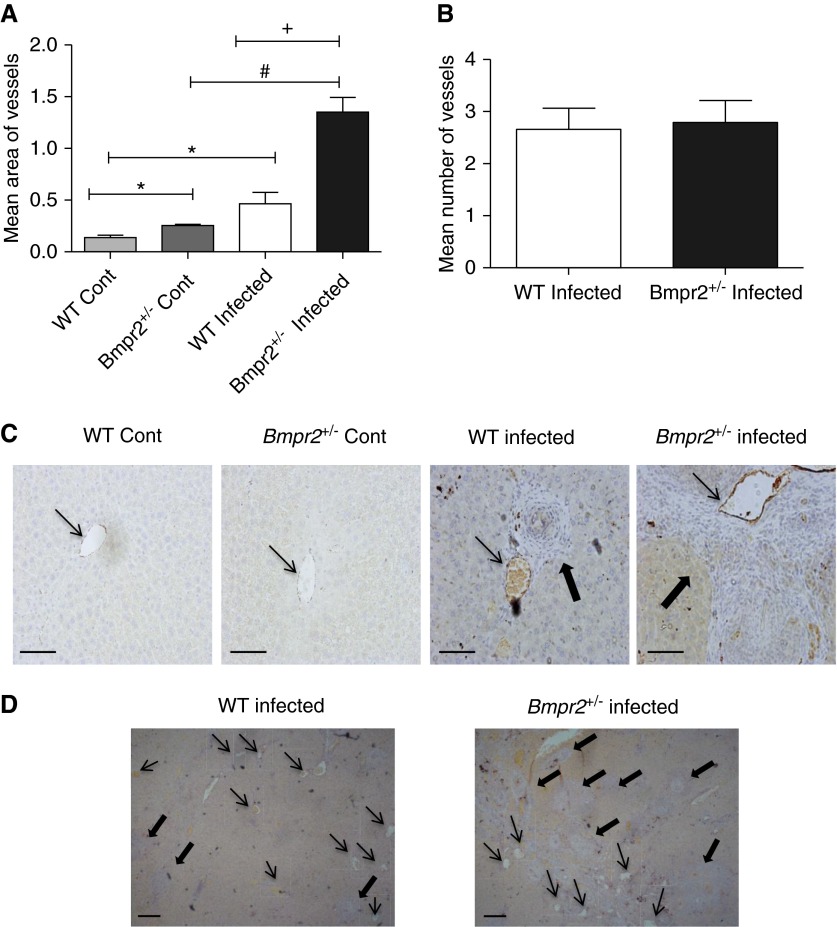
Figure 4.
(A) Quantification of mean vessel area (±SEM) of central hepatic veins in liver sections of wild-type (WT) (n = 4) and Bmpr2+/− (n = 4) control and infected mice. *P < 0.05 compared with WT control, #P < 0.05 compared with Bmpr2+/− control, +P < 0.05 compared with WT infected. (B) Quantification of the mean ± SEM number of vessels in the liver of WT (n = 5) and Bmpr2+/− (n = 6) infected mice. (C) Photomicrographs of von Willibrand factor–stained liver sections of WT and Bmpr2+/− control and infected mice at ×200 magnification. Scale bars = 100 μm. (D) Photomicrographs of von Willibrand factor–stained liver sections of WT and Bmpr2+/− infected mice at ×40 magnification. Scale bars = 100 μm. Thin arrows, hepatic central veins; thick arrows, granulomas. Bmpr2 = bone morphogenetic protein type 2 receptor; Cont = control.

