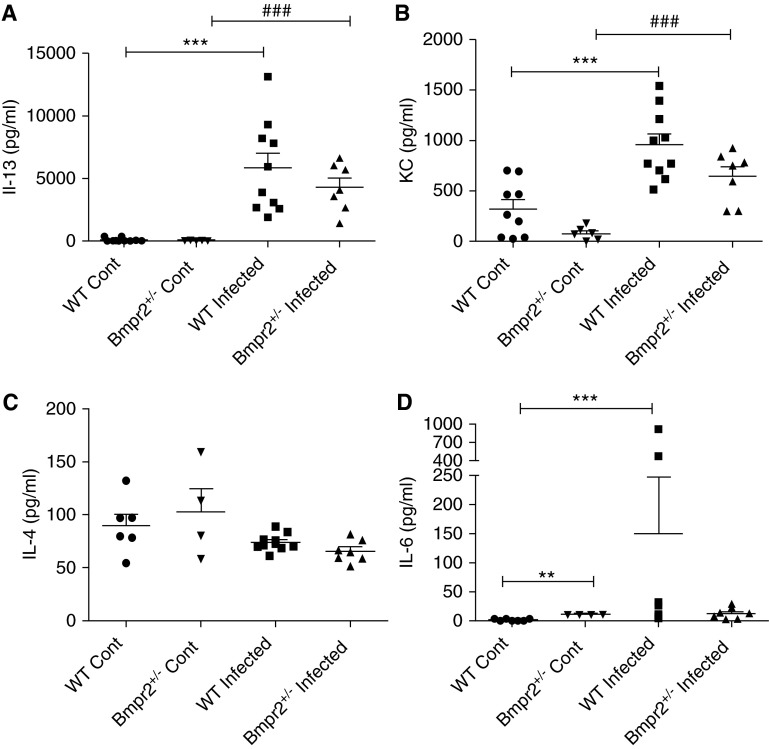
Figure 8.
Plots showing serum cytokine profiles in wild-type (WT) and Bmpr2+/−control and infected mice. (A) IL-13 (WT Cont n = 10, Bmpr2+/− Cont n = 5, WT infected n = 10, Bmpr2+/− infected n = 7); (B) keratinocyte chemoattractant (KC) (WT Cont n = 9, Bmpr2+/− Cont n = 6, WT infected n = 10, Bmpr2+/− infected n = 7); (C) IL-4 (WT Cont n = 6, Bmpr2+/− Cont n = 4, WT infected n = 10, Bmpr2+/− infected n = 7); (D) IL-6 (WT Cont n = 7, Bmpr2+/− Cont n = 4, WT infected n = 10, Bmpr2+/− infected n = 7). Data are presented as mean ± SEM. **P < 0.01 compared with WT control, ***P < 0.001 compared with WT control, ###P < 0.001 compared with Bmpr2+/− control. Bmpr2 = bone morphogenetic protein type 2 receptor; Cont = control.

