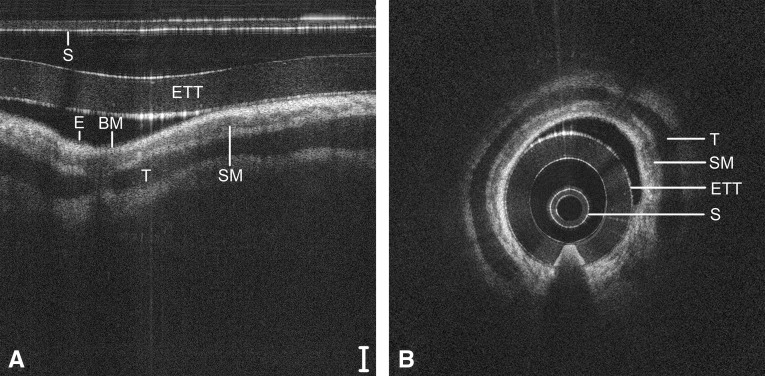
Figure 6.
Long-range optical coherence tomography image of the neonatal trachea, represented in a select region of Cartesian coordinates (A) and polar coordinates (B). Noise bands digitally removed for image clarity. Scale bar = 500 μm. BM = basement membrane; E = epithelium; ETT = endotracheal tube; S = sheath; SM = submucosa; T = tracheal cartilage.

