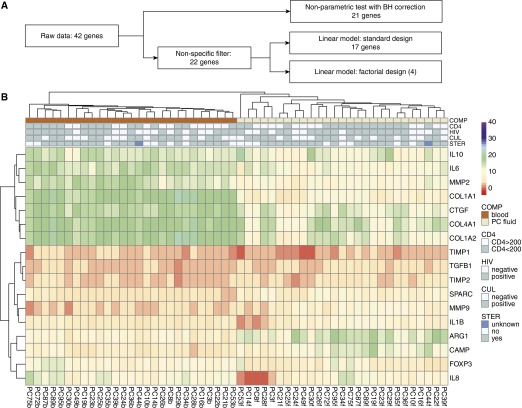
Figure 1.
(A) Outline showing the flow of data in the analytic pipeline. (B) Clustered heat map of 17 selected genes, showing blood and pericardial fluid samples grouped into two separate compartments with prominence of fibrosis-associated genes in pericardial fluid. Expression values expressed as delta cycle threshold relative to β-actin are shown on a continuous color scale. For each sample, sampling compartment (COMP), CD4 count category (CD4), HIV-1 infection status (HIV), tuberculosis culture status (CUL), and concurrent steroid (STER) use are shown in the column annotations. ARG1 = arginase 1; BH = Benjamini-Hochberg; CAMP = cathelicidin antimicrobial peptide; COL = collagen; CTGF = connective tissue growth factor; FOXP3 = forkhead box P3; MMP = matrix metalloproteinase; SPARC = secreted protein acidic and rich in cysteine; TGFB1 = transforming growth factor-β1; TIMP = tissue inhibitor of metalloproteinase.

