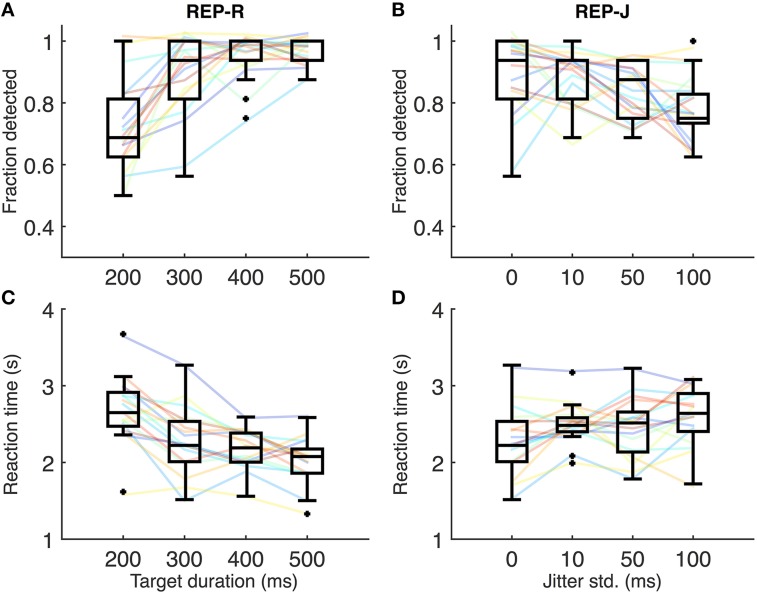
Figure 2.
(A) Fraction detected for REP-R conditions. Solid lines represent individual subjects, and boxplots summarize the data over the 17 subjects for a given stimulus condition. For display purposes only, a small amount of Gaussian noise (std = 1.5%) has been added to the y-values of the solid lines in (A–D) to spread out overlapping data points. (B) Fraction detected for REP-J conditions. (C) Mean reaction times for REP-R conditions. Solid lines represent mean reaction times for each subject, and boxplots are over the 17 subjects' means. (D) Mean reaction times for REP-J.

