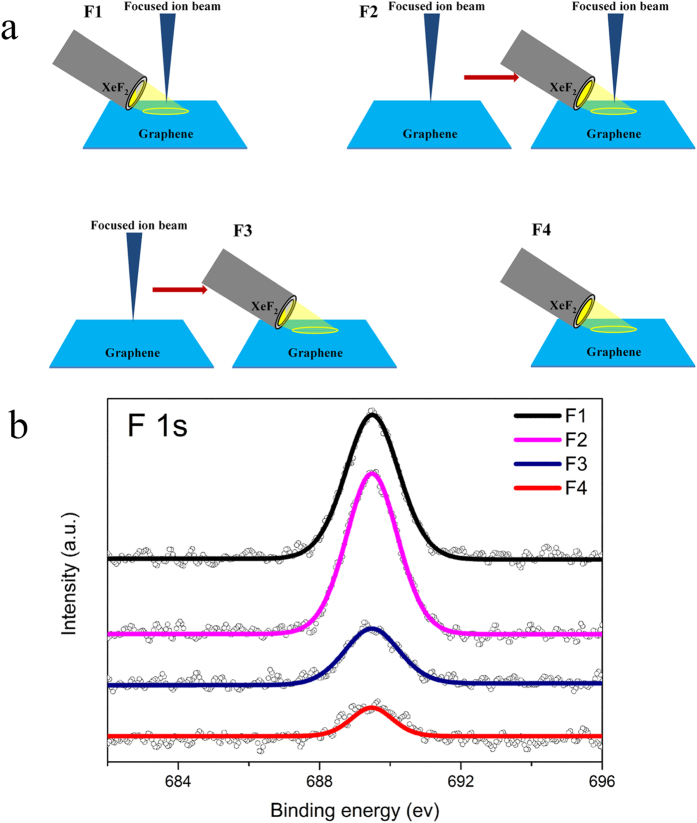
Figure 3. Schematics of comparison experiments and related XPS of F 1 s peaks.
The schematics of four different samples are shown in (a). F1: ion irradiation accompanied by simultaneous gas exposure (167 s). F2: first ion irradiation and ion irradiation again accompanied by gas exposure (167 s). F3: first ion irradiation and then only gas exposure (167 s). F4: only gas exposure (167 s) as a control experiment. In the schematics, each ion irradiation refers to 1013 ions/cm2. (b) XPS of F 1 s intensity comparison of different samples. Comparing the fluorine intensity of F1-F4, these relations are found: IF2 > IF1, IF3 > IF4 and IF1 ≈ 6IF4. F4 is the controlled experiment to study the influence of XeF2 exposure without irradiation.

