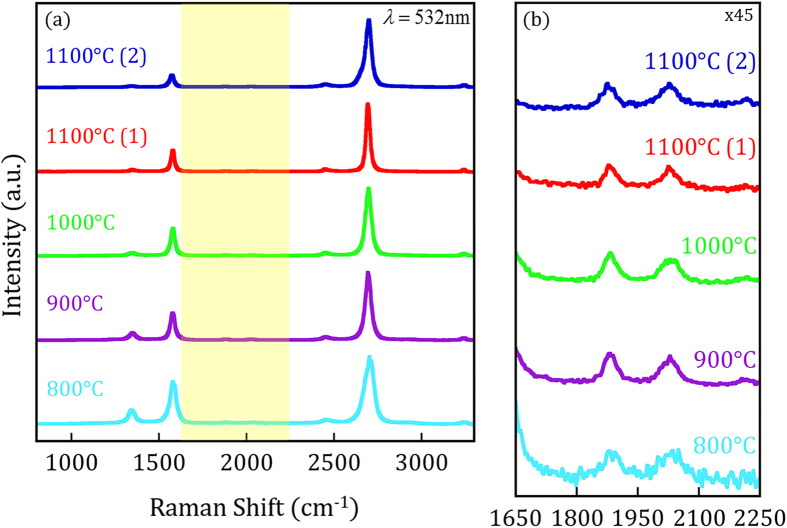
Figure 5. Normalized Raman spectra raw data using a laser excitation energy of EL = 2.33 eV, obtained for growth temperatures 800–1100 °C.
The spectra taken from the 1100 °C sample was acquired from the corresponding colored markers shown in Fig. 8a. (a) Raman spectra indicating the high quality graphene growth through PVD. The reduction in D-peak intensity as deposition temperature increases agrees with the ID/IG Raman maps and SEM images presented in Fig. 3. The area highlighted in yellow signifies the location of combination Raman modes magnified in (b). The peak shape, intensity, and location of the TS1 and TS2 combination Raman modes are indicative of turbostratic stacking.

