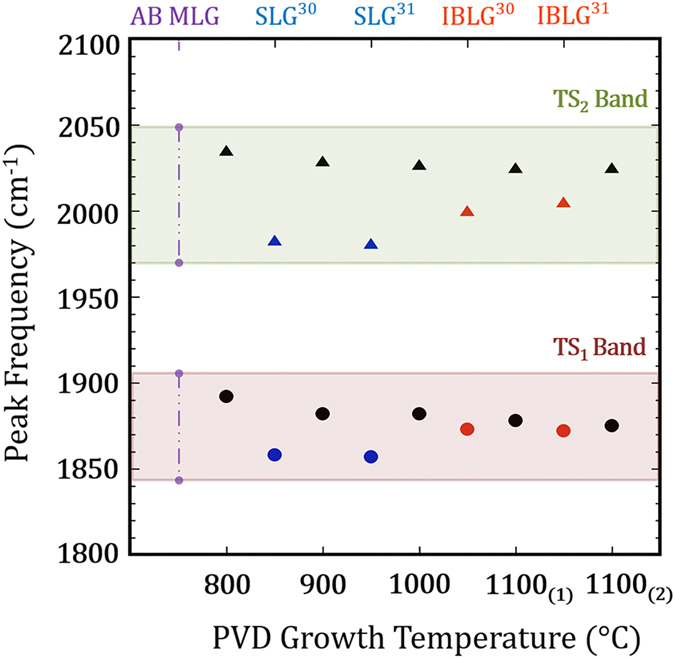
Figure 7. Combination Raman modes of turbostratic graphene compared to reported literature values.

The TS1 (circles) & TS2 (triangles) peak positions for different PVD deposition temperatures, shown with black markers. The SLG (blue) and IBLG (red) where added from Rao et al.30 and Cong et al.31 for reference. The peak positions of TS1 and TS2 are blue-shifted from the SLG and IBLG values. At 1100 °C growth temperatures, the TS1 peak nearly matches the position observed from IBLG while the TS2 peak remains blue-shifted from IBLG peak positions. The purple vertical dashed line represents the absence of prominent peaks for AB Bernal MLG.
