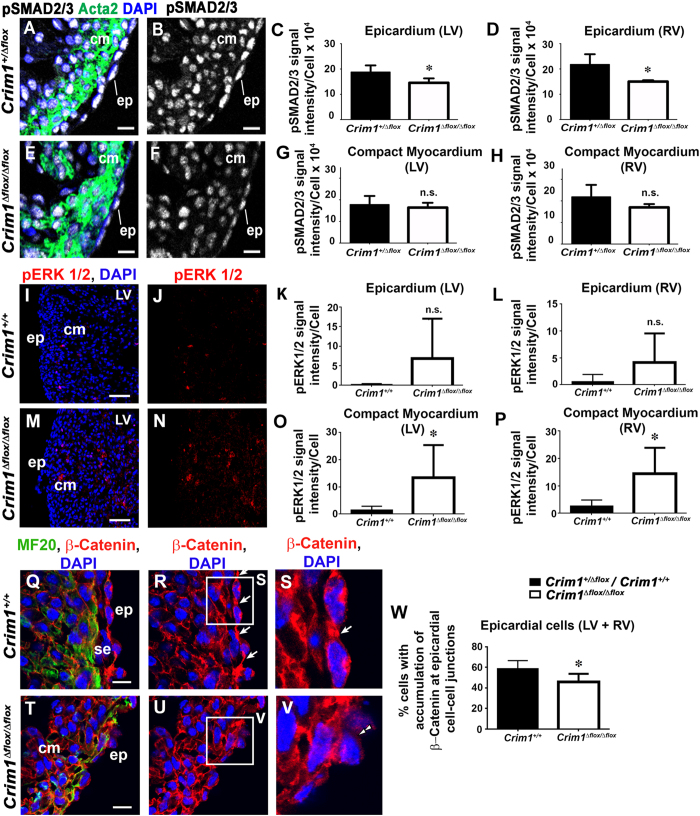
Figure 5. Changes in epicardial and myocardial signalling, alongside localisation of β-catenin in Crim1Δflox/Δflox hearts.
(A,B,E,F), Confocal images of ventricular sections of 13.0 dpc hearts from Crim1+/Δflox (A,B) and Crim1Δflox/Δflox (E,F) embryos stained for phospho-SMAD2/3 (white). (A,B) merged images of DAPI (blue) and actin (green) to delineate the myocardium with the phospho-SMAD2/3 (white) from B and F, respectively. (C,D,G,H) There was a reduction in phospho-SMAD2 signal intensity in epicardial cells of left and right ventricles of Crim1Δflox/Δflox hearts, but the levels in compact myocardial cells was unchanged (n = 4–5). Confocal images of ventricular sections of 13.5 dpc hearts from Crim1+/+ (I,J) and Crim1Δflox/Δflox (M,N) embryos stained for phospho-ERK1/2 (red). (I,M) merged images of DAPI (blue) and phospho-ERK1/2 (red). (K,L,O,P), There was an increase in phospho-ERK1/2 signal intensity in compact myocardial cells of left and right ventricles of Crim1Δflox/Δflox hearts, but the levels in epicardial cells was unchanged (n = 8–6). (Q,R,T,U) Confocal images of ventricular sections of 13.5 dpc hearts from Crim1+/+ (Q,R,S) and Crim1Δflox/Δflox (T,U,V) embryos stained for β-catenin (red). (Q,T) merged images of DAPI (blue) and MF20 (green) to delineate the epicardium with the β-catenin (red) from (R,S,U,V) respectively. (S,V) magnified views of boxed regions in (R,U). Note β-catenin distribution at epicardial cell-cell junctions of Crim1+/+ hearts (arrows, R,S), and a decreased accumulation at epicardial cell junctions in mutants (double arrowheads, V). (W) the percentage of epicardial cells with an accumulation of β-catenin at cell junctions (n = 5–6). cm, compact myocardium; ep, epicardium; s.ep, sub epicardium. n.s., not significant. *P < 0.05. Scale bars, (A,B,E,F) 10 μm (I,J,M,N) 50 μm (Q,R,T,U) 10 μm.

