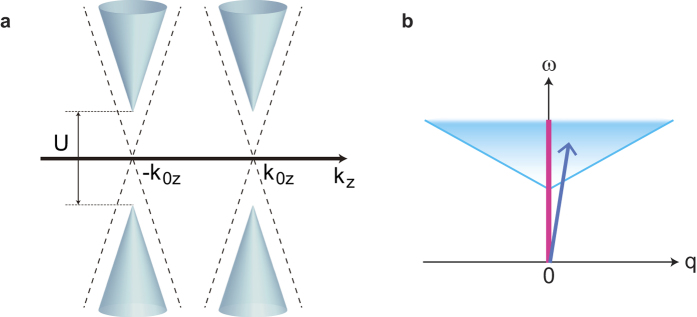
Figure 2. Energy spectrum of WMI.
(a) Poles of the Green’s function. Dashed line represents the band structure of a noninteracting Weyl semimetal. Energy bands are shifted by ± U/2 and show a Mott gap of U. (b) Excitation spectrum indicating the region of non-zero conductivity σ(q, ω). Excitation gap of U + vF|q| is finite for nonzero momentum transfer q. The spectrum is singular at q= 0 where gapless excitations are allowed due to k-local excitations without the energy cost of U.

