
Figure 3. Temperature dependence of the optical conductivity of WMIs.
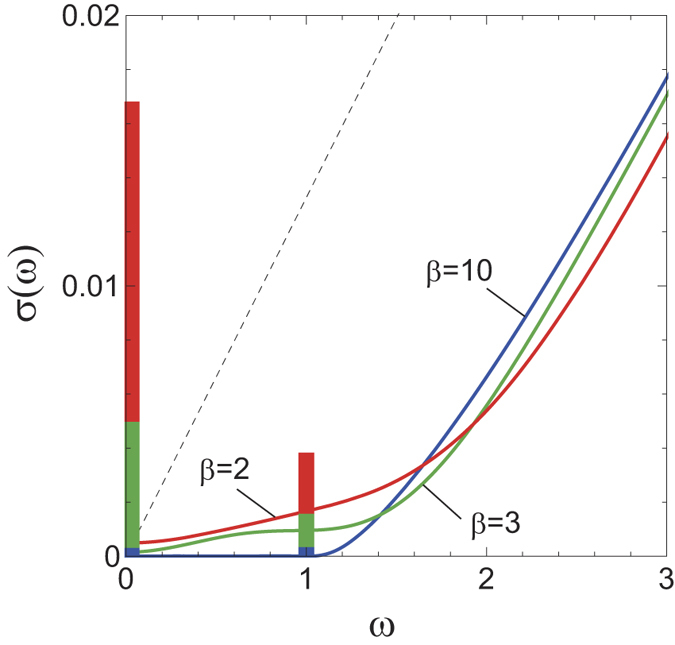
We plotted results for β = 10 (blue), β = 3 (green), and β = 2 (red). The delta functions at ω = 0 and U from the intraband contributions are denoted by bars whose heights represent mutual ratios of the weights. The dashed line represents σ(ω) for a free WF. We set U = 1.