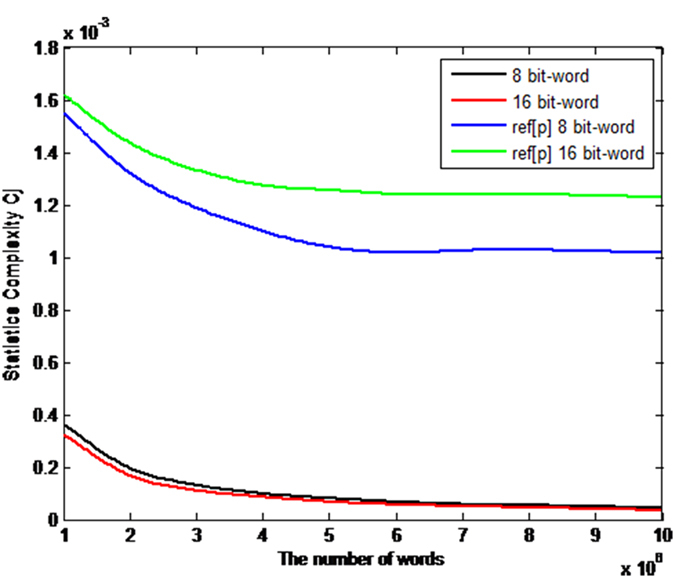
Figure 3. Comparisons in terms of intensive statistical complexity measure CJ respectively.

The black and red curves denote the intensive statistical complexity measure CJ for the number of 8 bits and 16 bits-words respectively in our proposal, while the blue and green curves represent the intensive statistical complexity measure CJ of the QW-based scheme14 for the number of 8 bits and 16 bits-words respectively. (see text in the section entitled Results).
