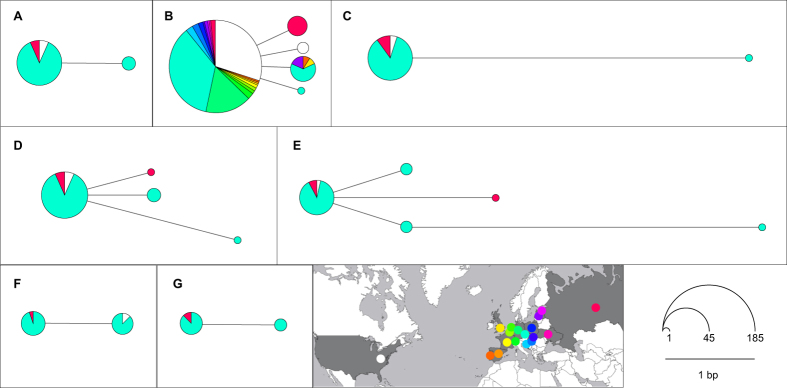
Figure 3. Median-joining networks for Pseudogymnoascus destructans DNA sequences.
Node centroid distances correspond to the number of substitutions between haplotypes and the node size to the number of isolates sharing the haplotype. Isolate origin is signified through different colours based on the inset map. The map was modified from http://www.amcharts.com/visited_countries/ (last accessed on 9 October, 2015). (A) TUB2 (n = 46), (B) ITS (n = 203), (C) CAM (n = 47), (D) TEF1α (n = 51), (E) sequences concatenated with TUB2, ITS, CAM and TEF1α (n = 34); haplotypes pooled according to the available sequence and gaps treated as missing data, (F) MAT1-1-1 (n = 27), (G) MAT1-2-1 (n = 19).

