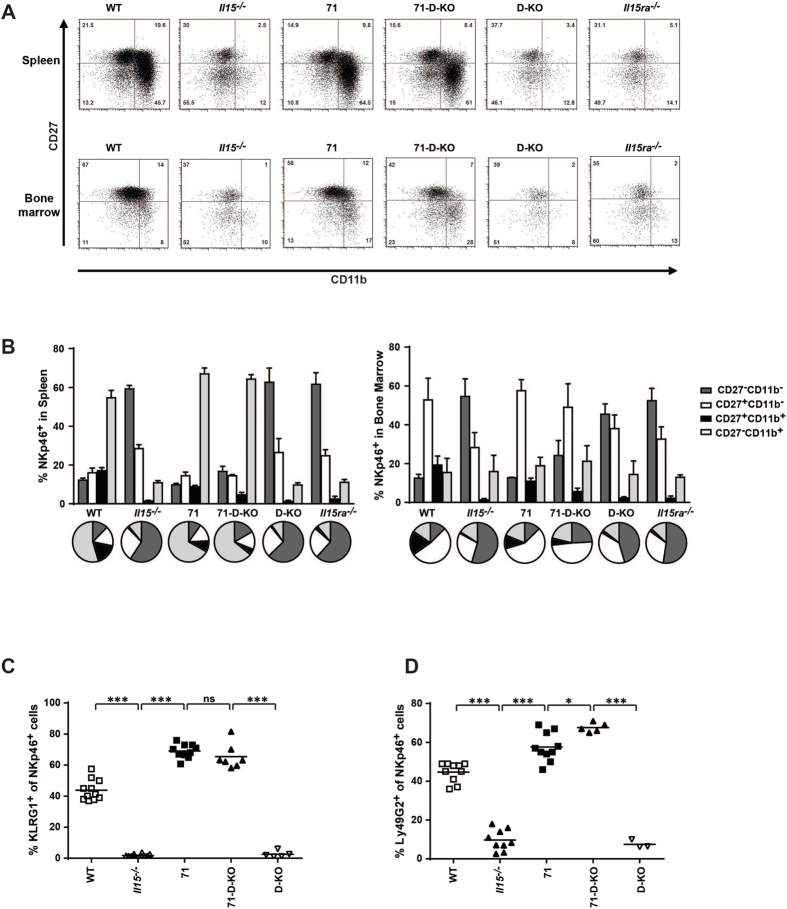
Figure 5. IL15-driven maturation of NK cells occurs independently of IL15 trans-presentation.
The maturation state of NKp46+ NK cells was analyzed flow cytometry. (A) Representative FACS plots of CD27 and CD11b staining on NKp46+ cells in the spleen and bone marrow. (B) Summarized frequencies of NK cell maturation stages in spleen and bone marrow (n = 4–7). Percentages of (C) KLRG1+ and (D) Ly49G2+ in NKp46+ cells in the spleen. Statistics: ***p<=0.001; *p<=0.05; ns = non significant.

