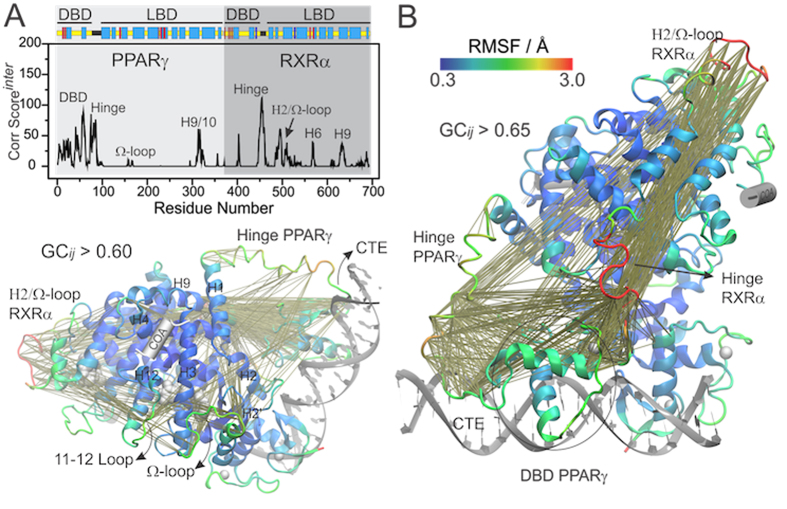
Figure 2. Large-scale inter-domain correlated motions on the full-length complex.
(A) Correlation score per residue, computed for inter-domain correlations with GCijinter > 0.6. (B) Localization of the most intense inter-domain correlations in the three-dimensional structure. The heterodimer PPARγ-RXRα was colored according to backbone RMSF, while other components are represented in silver. For the sake of clarity, the bottom left panel only shows inter-domain correlations that involve PPARγ residues.

