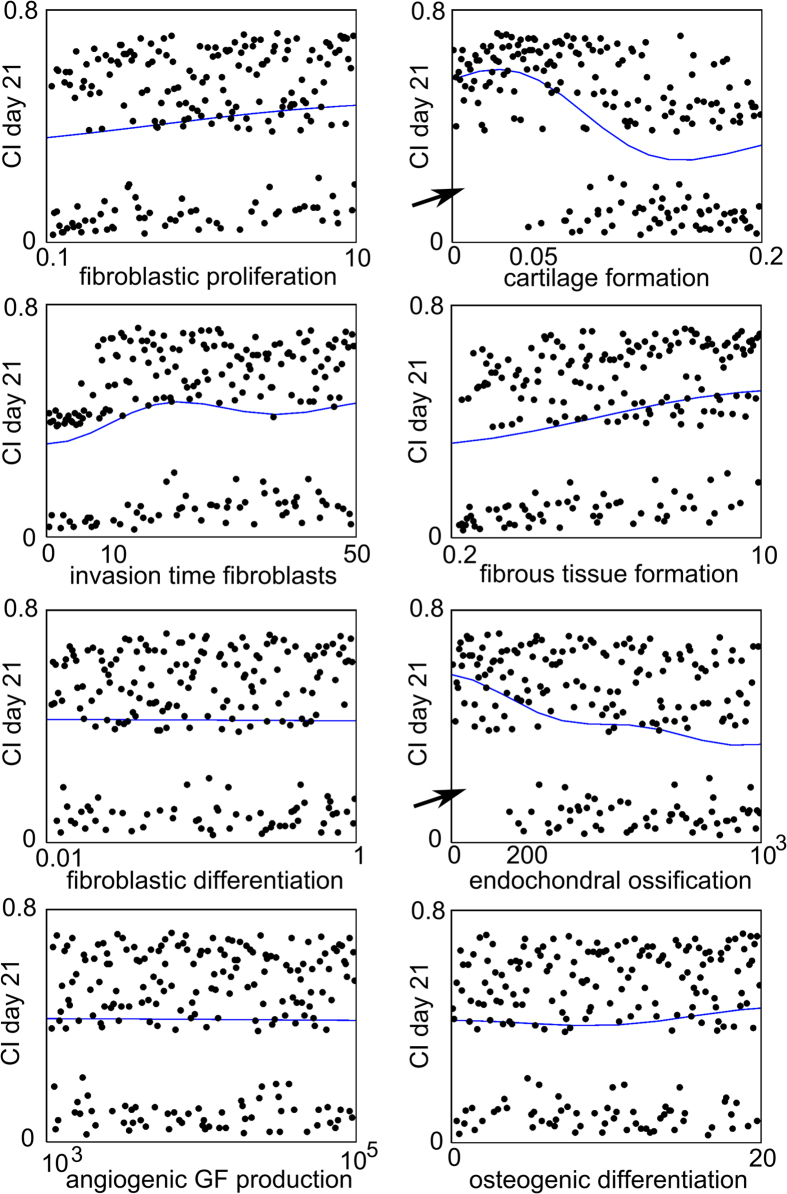
Figure 5. Marginal model plots for cf_BC, Af0, F4, Y11, Y3cb, Pmc, Pmf and Ggvc.
The horizontal axis shows the value of the parameter and the vertical axis shows the value of the CI response on Day 21. The dots indicate the actual results obtained from the computational model (each dot represents the CI response obtained for a particular combination of parameter values in the Nf1 range), and the solid line indicates the results predicted by the Gaussian process. Note that the actual results can be split up in two classes: one for which the CI value is high, resulting in impaired bone healing and one for which the CI value is low. GF = growth factor.

