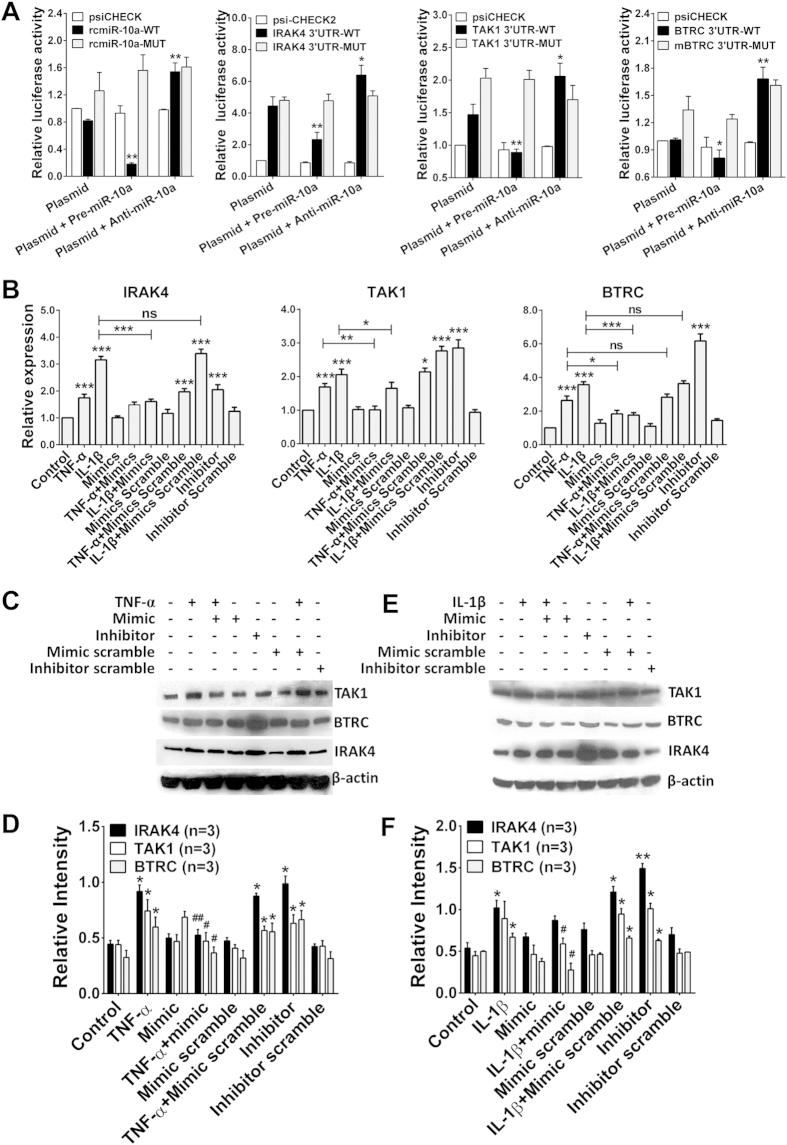
Figure 5. IRAK4, TAK1 and BTRC are target genes of miR-10a.
(A) Dual-luciferase reporter assays of rcmiR-10a/mrcmiR-10a, IRAK4/mIRAK4, TAK1/mTAK1 or BTRC/mBTRC, either alone or in the presence of miR-10a precursors or inhibitors. Vectors containing rcmiR-10a and mrcmiR-10a were used as positive controls. The decrease in RLuc was measured and normalized to FLuc activity, and the constructed vector was normalized to an empty psi-CHECK-2 vector. *P < 0.05, **P < 0.01 compared with the plasmid-only group. (B) FLS cells (n = 3 samples, same as in Fig. 5C, E) were treated as indicated, and IRAK4, TAK1 and BTRC mRNA levels were detected through real-time PCR. *P < 0.05, **P < 0.01, ***P < 0.001 compared with the control group or between the indicated groups. (C) FLS cells were treated with TNF-α in the presence of miR-10a mimics or inhibitors, and IRAK4, TAK1 and BTRC expression levels were detected via Western blotting. (D) Statistical analysis of (C). (E) FLS cells were treated with IL-1β in the presence of miR-10a mimics or inhibitors, and IRAK4, TAK1 and BTRC expression levels were detected through Western blotting. (F) Statistical analysis of (E). *P < 0.05, **P < 0.01, ***P < 0.001 compared with the control group or between the indicated groups.

