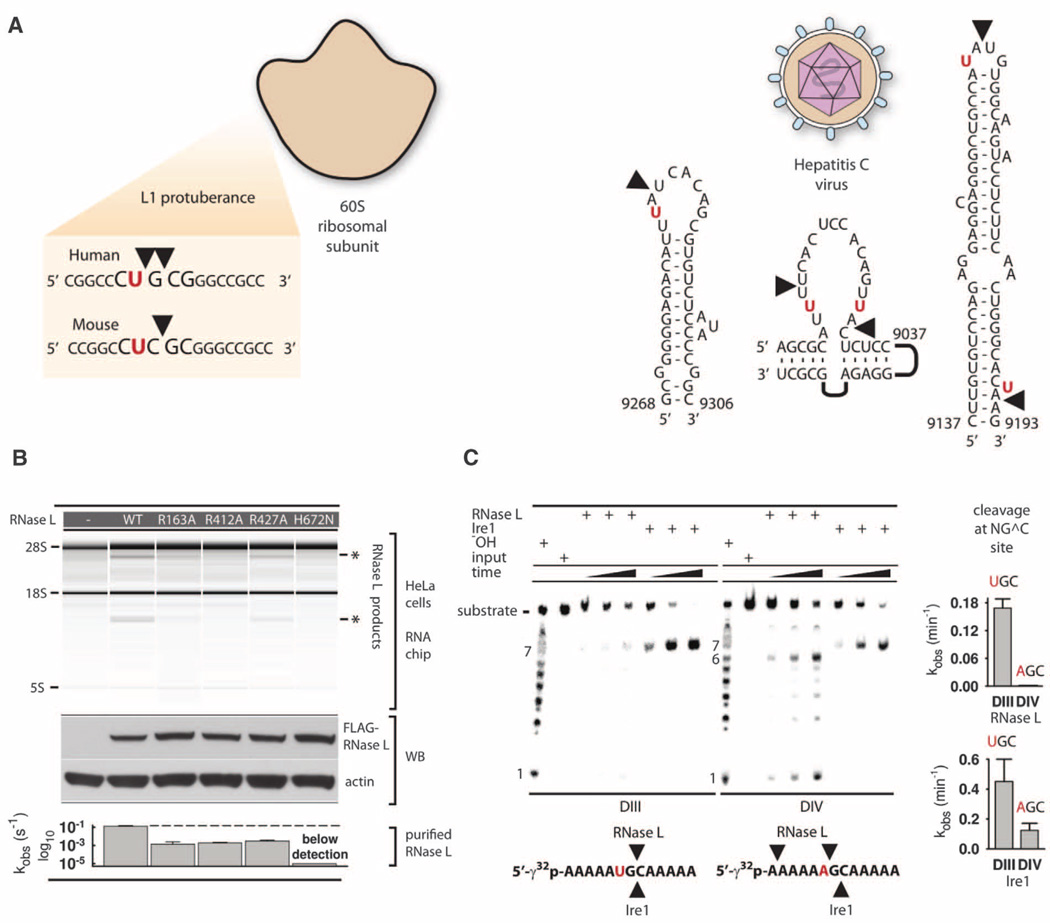
Fig. 4. Cleavage of biological targets.
(A) Site selection by RNase L in mammalian ribosomes and hepatitis C virus RNA. (B) Total RNA from HeLa cells cotransfected with plasmids encoding RNase L mutants or not encoding a protein (–), and 2–5A. Protein expression levels were analyzed by Western blot (WB). The bar graph shows compiled data from in vitro assays in Fig. 2A and fig. S4D. (C) Cleavage of substrates DIII and DIV by RNase L and Ire1KR32. Bar charts show quantification of cleavage. Error bars show mean ± SE of a single-exponential fitting (RNase L) and two time courses (Ire1KR32).

