. 2015 Oct;35(4):272–276.
© Copyright by Società Italiana di Otorinolaringologia e Chirurgia Cervico-Facciale
This is an Open Access article distributed under the terms of the Creative Commons Attribution Non-Commercial No Derivatives License, which permits for noncommercial use, distribution, and reproduction in any digital medium, provided the original work is properly cited and is not altered in any way. For details, please refer to http://creativecommons.org/licenses/by-nc-nd/3.0/
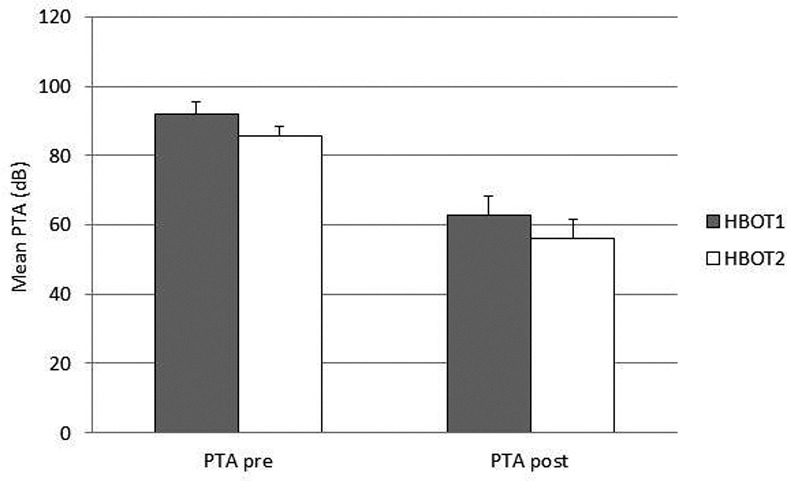
Fig. 2.

Average PTA for each protocol before and after treatment.
