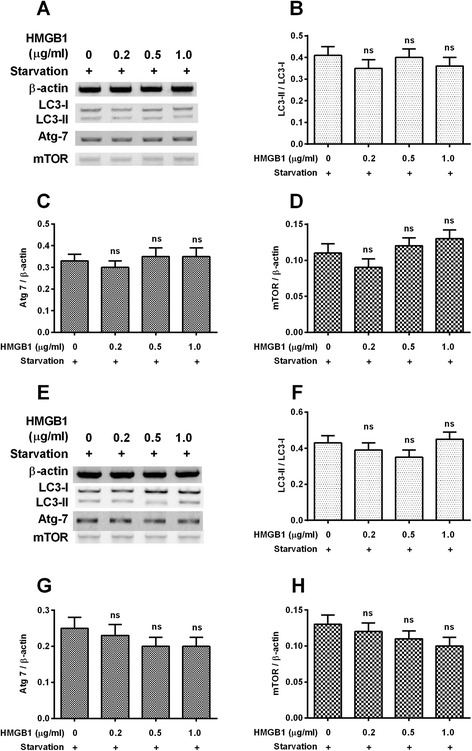
Fig. 4.

Western blot analysis of autophagy-associated markers in the PC12 (Synwt) or the PC12 (Synmt) cells, which were treated with HMGB1. a: Western blotting assay of LC3-I, LC3-II, Atg 7 and mTOR in the PC12 (Synwt) cells which were treated with 0, 0.2, 0.5 or 1 μg/mL HMGB1, under starvation for 24 hours; b: Ratio of LC3-II to LC3-I in the starvation-treated PC12 (Synwt) cells with HMGB1 treatment; c and d: Relative level of Atg 7 (c) and mTOR (d) levels to β-actin in the PC12 (Synwt) cells with HMGB1 treatment; e: Western blotting assay of LC3-I, LC3-II, Atg 7 and mTOR in the PC12 (Synmt) cells which were treated with 0, 0.2, 0.5 or 1 μg/mL HMGB1, under starvation for 24 hours; f: Ratio of LC3-II to LC3-I in the starvation-treated PC12 (Synmt) cells with HMGB1 treatment; g and h: Relative level of Atg 7 (g) and mTOR (h) levels to β-actin in the PC12 (Synmt) cells with HMGB1 treatment. Data was averaged for triple independent results, ns: no significance
