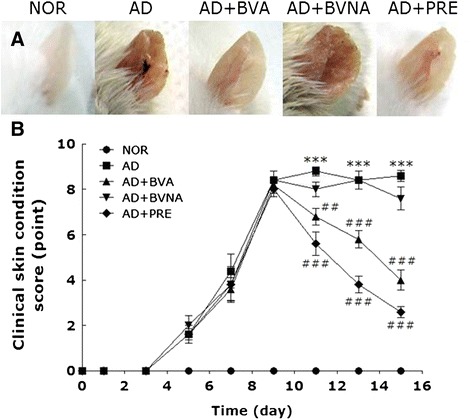
Fig. 2.

Representative images (a) of mouse ears and scoring graph (b) in the NOR, AD, AD + BVA, AD + BVNA and AD + PRE groups. The graph indicates time-course severities of atopic dermatitis by scoring each image between 0 and 9 points depending on the following skin symptoms: scaling and dryness, hemorrhage and excoriation, and edema and redness. The arrow indicates the initiation of BV or prednisolon treatment. *** p < 0.001 vs. the NOR group; ## p < 0.01, ### p < 0.001 vs. the AD group
