Fig. 5.

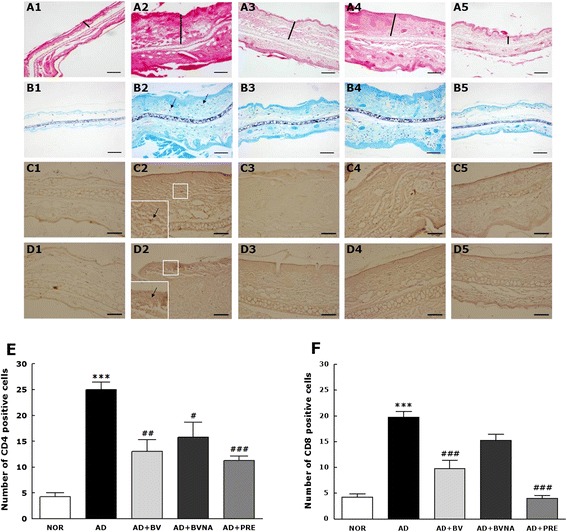
Histological images and graphs indicating relative percentage of CD4- and CD8-immunopositive cells of the ear sections. Ear sections in each group were stained with hematoxylin and eosin (a1-a5), toluidine blue (b1-b5), anti-mouse CD4 IgG (c1-c5) and anti-mouse CD8 IgG (d1-d5). Black scale bar indicates 100 μm (100× magnification). Black thick lines in the images of H-E staining indicate the thickness of ear skins. Small white squares (200×) in the centers of immunohistological staining images (c2 & d2 of AD group) are magnified in the lower left corners to observe CD4- and CD8- positive cells infiltrated into the skin tissues. The representative CD4- and CD8-immunopositive cells were indicated by black arrows in indicated in small white squares in C2 and D2, respectively. The numbers of CD4- and CD8-immunopositive cells in the fixed area of the images are depicted in the bar graphs e and f, respectively, below the histological images. IgG, immunoglobulin G; CD, cluster of differentiation. *** p < 0.001 vs. the NOR group; # p < 0.05, ## p < 0.005 and ### p < 0.001 vs. the AD group
