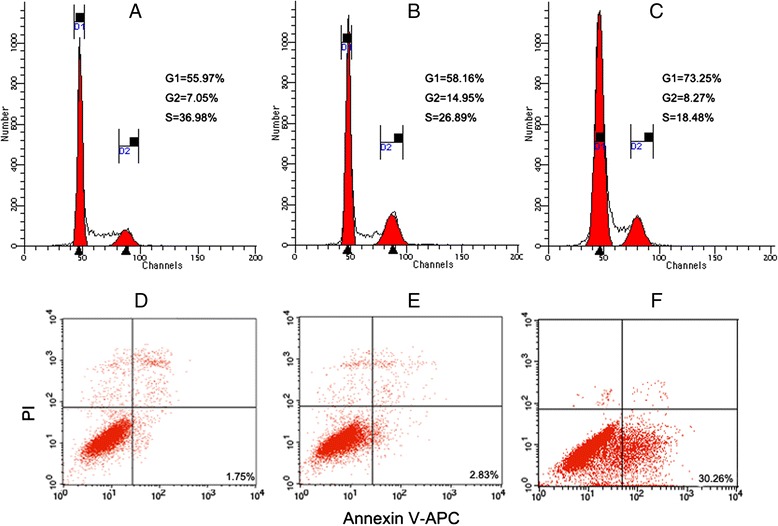
Fig. 5.

NEAT1 siRNA induced G1 phase arrest and apoptosis of Hep-2 cells. Flow cytometric analysis of the cell cycle of Hep-2 cells in each group: a blank control, b control lentivirus transduced Hep-2 cells, c NEAT1 siRNA lentivirus transduced Hep-2 cells. The dot plot of the X-axis (FL4) represented Annexin V fluorescence and the Y-axis (FL2) represented PI fluorescence. d Representative flow histograms of Hep-2 cells without any treatment. e Representative flow histograms of Hep-2 cells transduced with GFP-lentivirus control. f Representative flow histograms of Hep-2 cells transduced with NEAT1 siRNA lentivirus
