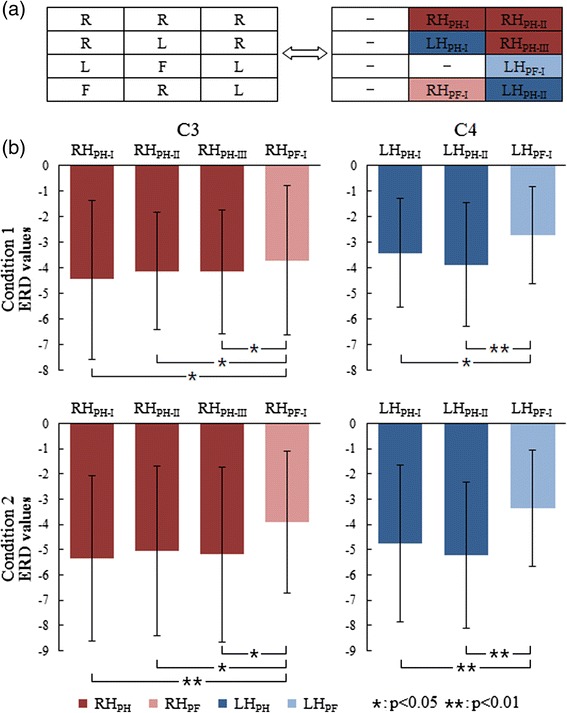
Fig. 5.

Illustration of ERD analysis. a Each row in the left diagram represents three sub-movements in each sequence. The diagram on the right contains the definition of the corresponding sub-movement in each sequence against the diagram on the left. “-” means no definition. b The comparison of ERD values from the 12 subjects at electrodes C3 (left column) and C4 (right column) for the first condition (upper panel) and second condition (lower panel). Dark red represents right hand imagery with prior hand imagery, while light red represents right hand imagery with prior foot imagery. Dark blue represents left hand imagery with prior hand imagery, while light blue represents left hand imagery with prior foot imagery. Conditions 1 and 2 indicate that the time intervals are 1 s and 2 s, respectively, for sub-movement imagination. Condition pairs that significantly differ from each other are indicated by a single asterisk (p < 0.05) or two asterisks (p < 0.01)
