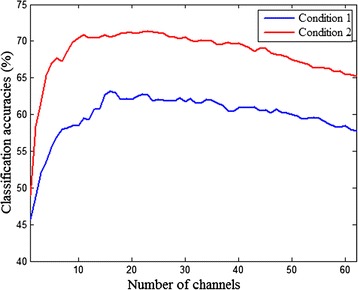
Fig. 8.

The average result of SVM-RFE in PSD-based method from the 12 subjects. The horizontal and vertical axes represent the number of channels selected and the classification accuracies, respectively. The blue and red lines represent the first and second conditions, respectively. Conditions 1 and 2 indicate that the time intervals are 1 s and 2 s, respectively, for sub-movement imagination
