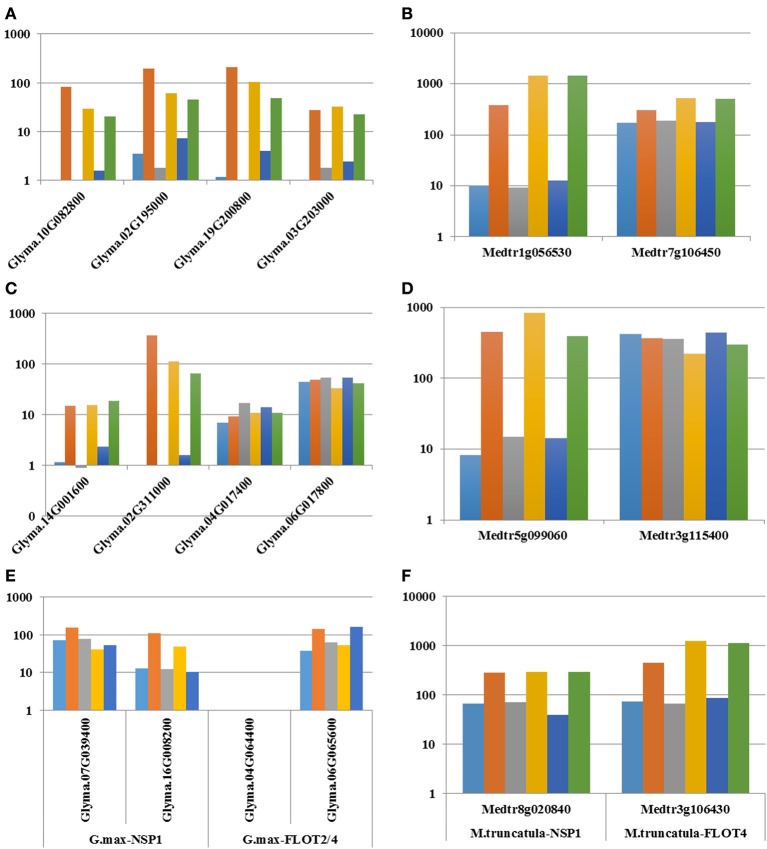
Figure 2.
Relative expression levels of NF-YA1/2 (A, B), NIN (C, D), NSP1, and FLOT2/4 (E, F) M. truncatula genes (B, D, F), and their G. max orthologs (A, C, E) in inoculated and mock-inoculated root hair cells. Gene IDs are highlighted on the x-axis. The relative expression levels of the genes (log10 scale) are indicated on the y-axis. Gene expression datasets were mined from the G. max and M. truncatula root hair transcriptomic datasets (Libault et al., 2010b; Breakspear et al., 2014). For G. max: blue, 12H UN; orange, 12H IN; gray, 24H UN; yellow, 24H IN; dark blue, 48H UN; and green, 48H IN; For M. truncatula: blue, 1D UN; orange, 1D IN; gray, 2D UN; yellow, 2D IN; dark blue, 3D UN; and green, 3D IN.

