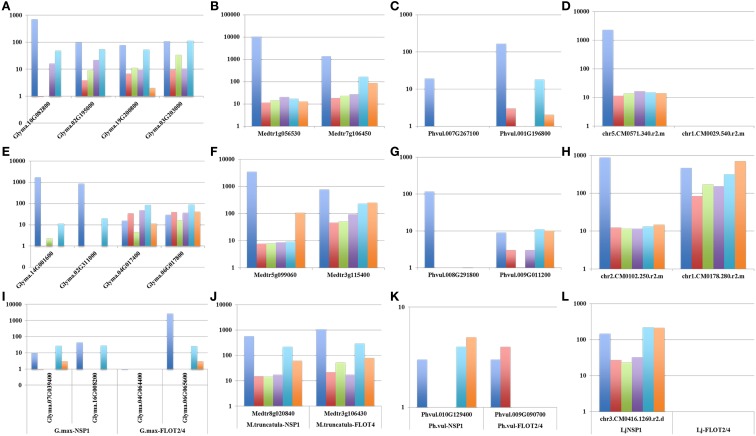
Figure 3.
Relative expression levels of NF-YA1/2 (A–D), NIN (E–H), NSP1 and FLOT2/4 (I–L) of M. truncatula genes (B, F, J), and their G. max orthologs (A, E, I), P. vulgaris orthologs (C, G, K) and L. japonicus (D, H, L) in various plant organs (i.e., blue, nodule; orange, flower; gray, pod; yellow, leaf; dark blue, root; and green, root tip). Gene IDs are highlighted on the x-axis. The relative expression levels of the genes (log10 scale) are indicated on the y-axis. Gene expression datasets were mined from the G. max, M. truncatula, P. vulgaris, and L. japonicus atlases datasets (Benedito et al., 2008; Libault et al., 2010c (http://mtgea.noble.org/v3/); Verdier et al., 2013; O'Rourke et al., 2014).

