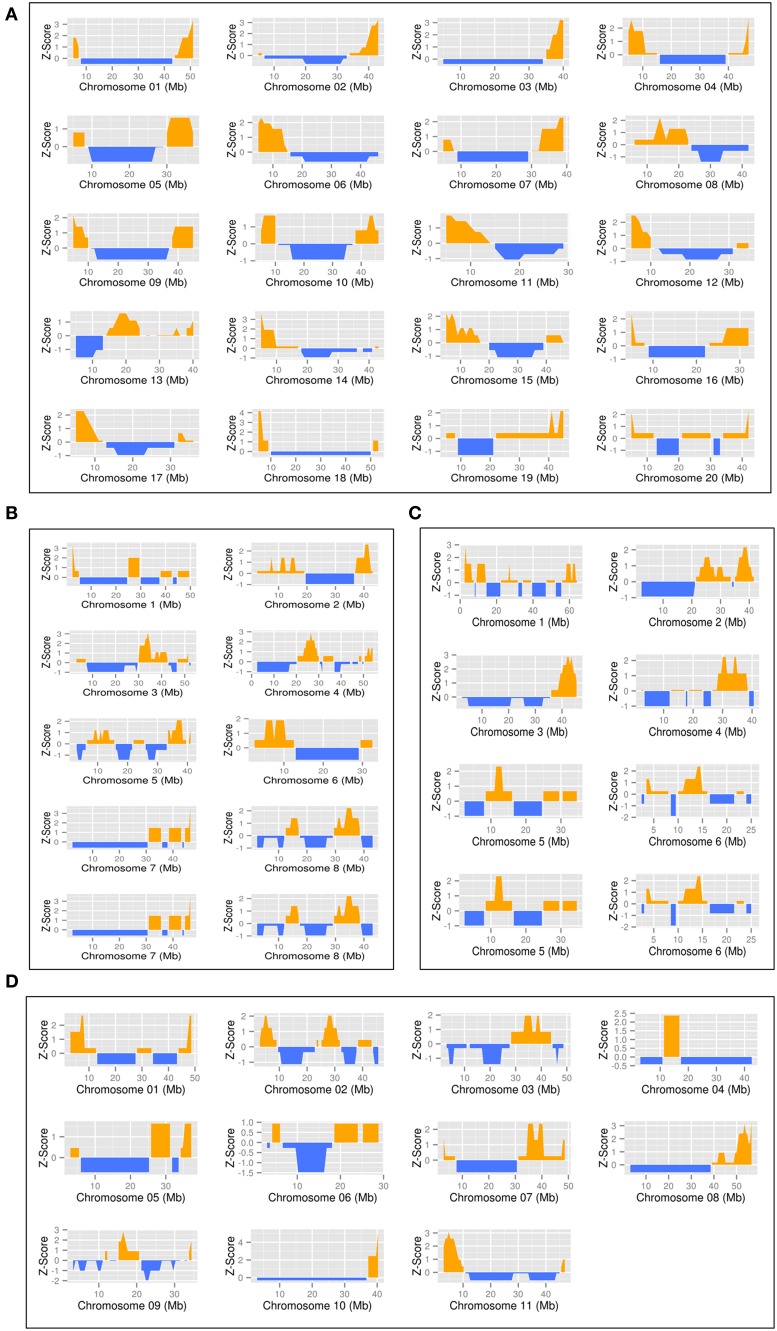
Figure 5.
Representation of the density of the legume nodulation genes along each legume chromosome. Gene density is represented by a z-score in a 10 Mb sliding window (step 1 Mb) along each chromosomes for each legume genome. Positive values are in orange, negative value in blue. The position on the chromosomes are indicated in Mb. The genomes represented are Glycine max (A), Medicago truncatula (B), Lotus japonicus (C), and Phaseolus vulgaris (D).

