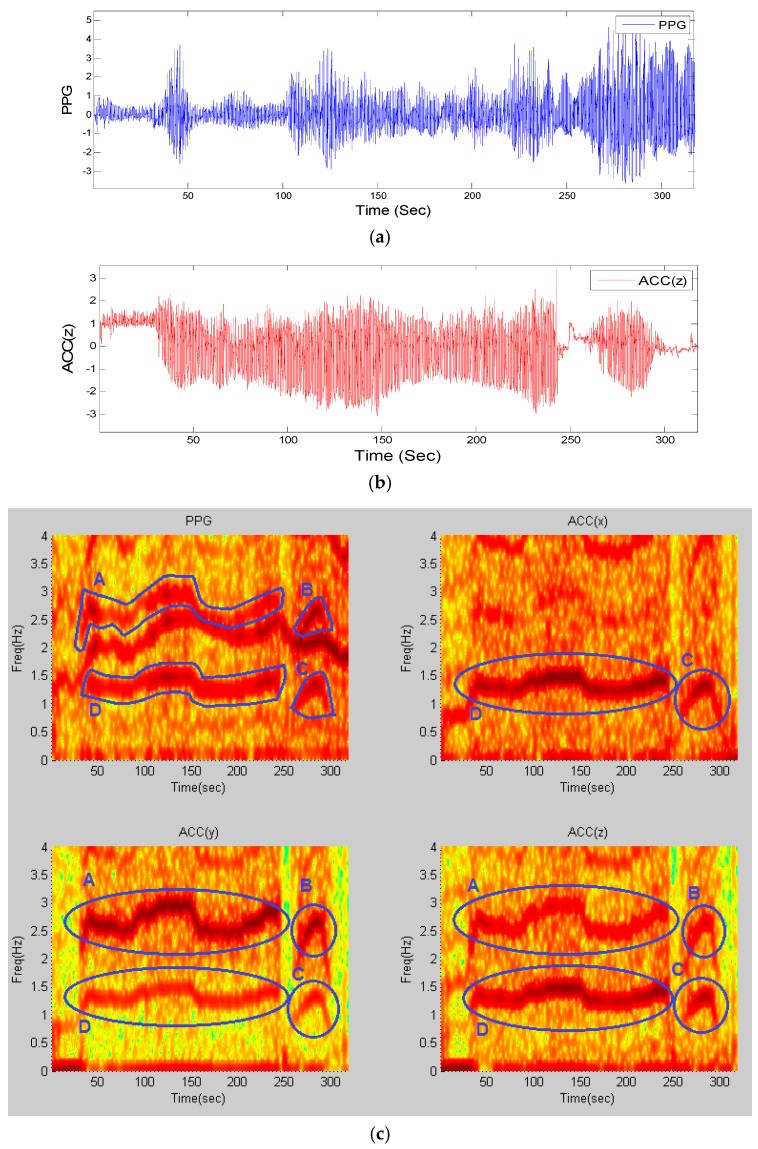
Figure 1.
Time-frequency spectra of recording #8 from dataset (1): (a) PPG signal; (b) simultaneous Accelerometer-Z signal; (c) (Top-Left) TF spectrum of PPG; (Top-Right) TF spectrum of ACC(x); (Bottom-Left) TF spectrum of ACC(y); (Bottom-Right) TF spectrum of ACC(z); all computed from stage (1) of the algorithm. Blue circles and letters represent movement elements in all four spectra.

