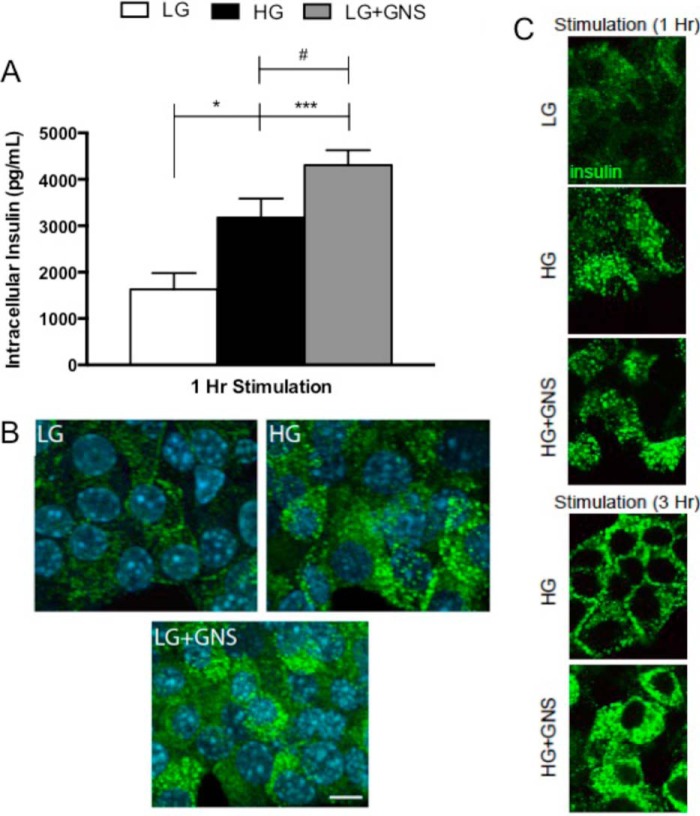
FIGURE 2.
O-GlcNAc increased Min6 intracellular insulin levels. A, cells treated in pharmacological conditions for 1 h were harvested and lysed for intracellular insulin measurements using RIA. Values are presented as intracellular insulin levels (pg/ml) over time, and data show the mean ± S.E. Significance was determined using an ordinary one-way ANOVA (n = 6; *, p < 0.05; ***, p < 0.001 versus LG; #, p < 0.05 versus HG). B, Min6 were incubated in LG, HG, and LG+GNS for 1 h and fixed for immunohistochemical and confocal microscopy analysis. Preproinsulin-, proinsulin, and mature insulin are stained green, and the nucleus is stained blue (n = 3). C, Min6 cells treated in LG, HG, and HG+GNS were fixed for immunohistochemical and confocal microscopy analysis after 1 h incubation (top panel). Min6 cells treated for 3 h in HG or HG+GNS were prepared and analyzed as described (bottom panel). Preproinsulin, proinsulin, and mature insulin are again stained green (n = 3).

