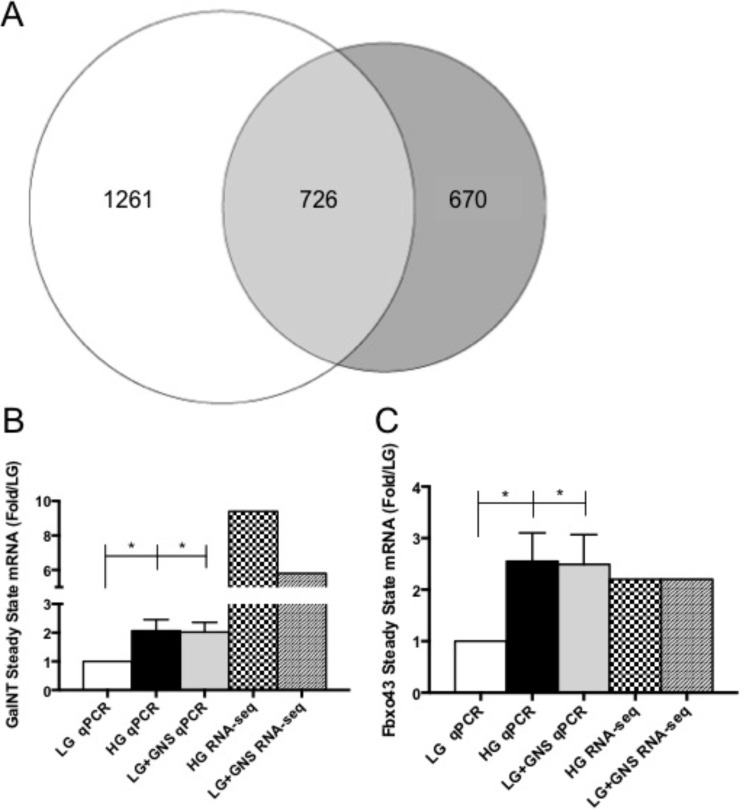
FIGURE 5.
HG stimulation and O-GlcNAc elevation regulated overlapping gene expression profiles in Min6 cells. A, in all, the expressions of 2657 genes were altered in either HG or LG+GNS treatment. HG alone affected 1261 genes in Min6 cells, whereas LG+GNS influenced 670. Combined, HG and LG+GNS changed the expression of 726 common genes that represent ∼27.3% of total genes affected (n = 1). RNA-sequencing expression changes were validated and compared using qPCR for Galnt7 (B; n ≥ 5) and Fbxo43 (C; n ≥ 5). All data are shown as the mean ± S.E. Significance was determined using an ordinary one-way ANOVA. *, p < 0.05 versus LG.

