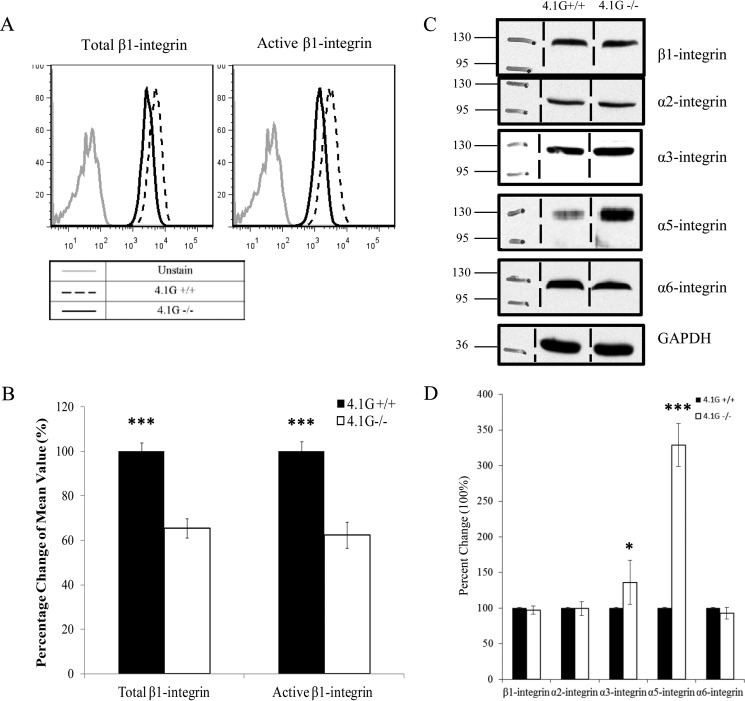
FIGURE 4.
Decreased surface expression and activity of β1 integrin in 4.1G−/− MEF cells. A and B, surface expression of total and active-form β1 integrins in 4.1G+/+ and 4.1G−/− MEF cells was measured by flow cytometry. The representative profiles and quantitative analysis (the mean fluorescence intensity ± S.E. from three independent experiments) are shown in A and B, respectively (***, p < 0.001). For simplicity, an autofluorescence control from only wild-type cells is shown. C, Western blot analysis of integrins in 4.1G+/+ and 4.1G−/− MEF cells. 35 μg of protein of total lysates was probed with the indicated antibodies. A GAPDH immunoblot served as a loading control. D, quantitative analysis from three independent experiments. Standard deviations are depicted by the error bars, and Student's t test values for significance were as follows: *, p < 0.1; ***, p < 0.001.

