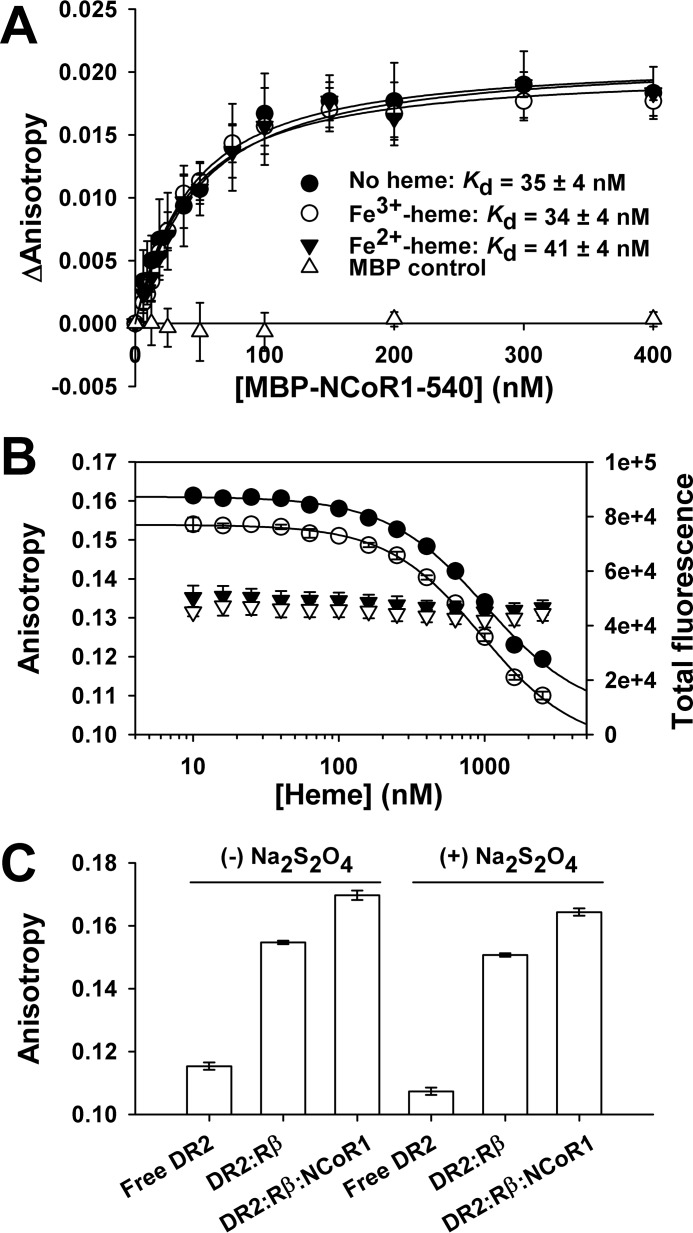
FIGURE 13.
Fe3+/Fe2+-heme has a negligible effect on the affinity of MBP-NCoR1–540 for FLRev-erbβHGS bound to TR-Rev-DR2 determined with fluorescence anisotropy. A, assay mixtures containing 1 ng μl−1 poly(dI-dC), 20 nm TR-Rev-DR2, 100 nm FLRev-erbβHGS, and increasing concentrations of MBP (open triangles) or MBP-NCoR1–540 in the absence (filled circles) or presence of 150 nm Fe3+-heme (open circles) in 0.5× TNGD were incubated for 2 h at 4 °C prior to quantifying the anisotropy of TR-Rev-DR2 using a microplate reader. Fe2+-heme complexes were generated by the addition of 5 mm dithionite and the anisotropy read within 10 min to avoid oxidation (solid inverted triangles). Data represent the average of three independent experiments ± S.D. and are fit with Equation 1, holding the concentration of the TR-Rev-DR2·FLRev-erbβHGS complex constant at 11.6 nm (see “Results” for details). B, assay mixtures were prepared as described in A, except the concentration of MBP-NCoR1–540 was held constant at 30 nm (∼Kd) with increasing concentrations of Fe3+-heme (closed circles) or Fe2+-heme (open circles). Dithionite addition led to a <10% quenching of total fluorescence, which likely accounts for the uniform decrease in anisotropy (compare total fluorescence data in the absence (closed inverted triangles) and presence (open inverted triangles) of dithionite), which likely accounts for the uniform decrease in anisotropy. Raw anisotropy values are plotted and represent the average of triplicate experiments ± S.D. The data are fit with a four-parameter logistics curve to determine the IC50. C, heme-free samples of 20 nm TR-Rev-DR2 (Free DR2), 20 nm TR-Rev-DR2, and 100 nm FLRev-erbβHGS (DR2:Rβ), and the same mixture but with saturating levels of 400 nm MBP-NCoR1–540 (DR2:Rβ:NCoR1) ± 5 mm dithionite are shown for reference. The data represent the average of three experiments ± S.D.

