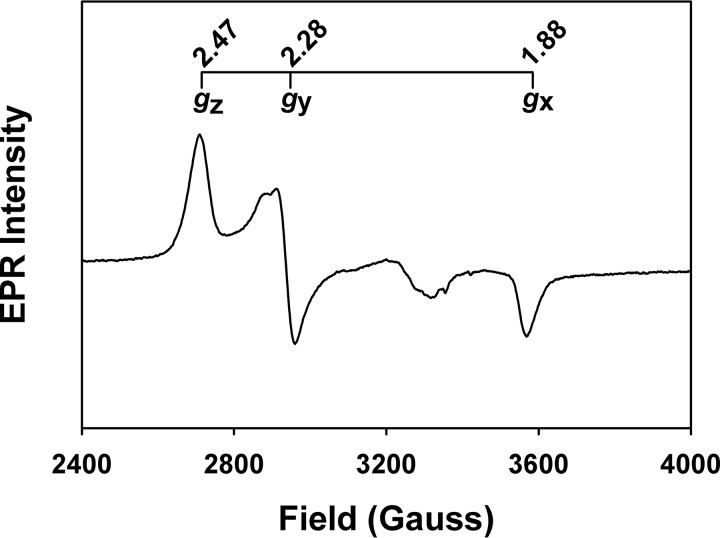
FIGURE 4.
EPR spectrum of the FLRev-erbβ·Fe3+-heme complex. The FLRev-erbβMGC sample was prepared as described under “Experimental Procedures”; the g values for the major rhombic feature are depicted, although other minor features exist that are likely due to the heterogeneity of the axial Cys-thiolate protonation state.

