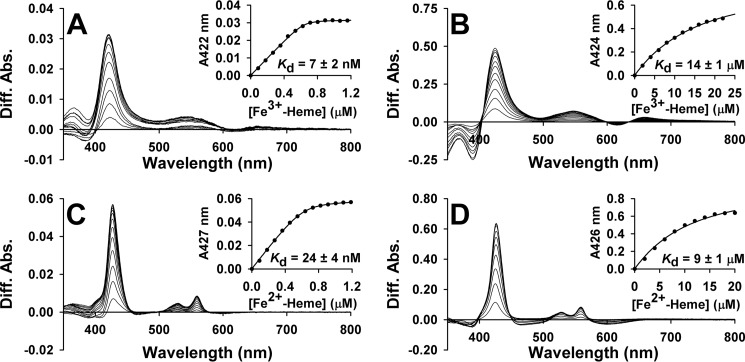
FIGURE 5.
Representative UV-visible difference titrations of Fe3+/Fe2+-heme into thiol-reduced FLRev-erbβ and the H568F/C384A variant under anaerobic conditions. Stock solutions of Fe3+/Fe2+-heme were titrated into 1 ml of 0.5× TNG buffer containing either 0.8 μm thiol-reduced FLRev-erbβMGC (A, Fe3+-heme; C, Fe2+-heme) or 4 μm H568F/C384A (B, Fe3+-heme; D, Fe2+-heme) under anaerobic conditions at 20 °C. A reference cuvette containing only buffer was used to subtract the absorbance of free heme at each concentration. The absorbance of the Soret band maximum for each titration point was plotted as a function of heme concentration and the data fitted with Equation 1 (insets). Because the titration of MGC is stoichiometric, [P] in Equation 1 was left as a variable, as the inflection point of the fit (representative of [P]) was sometimes slightly lower than the known concentration of protein in the cuvette (0.8 μm). Thus, the ratio of [P] determined from the fit to the known [P] is between 0.8 and 1, indicating a 1:1 heme:MGC stoichiometry. For fitting of H568F and H568F/C384A data, [P] = 4 μm. Titrations of HGS and H568F, omitted for brevity, closely resembled those depicted.

