
FIGURE 3.
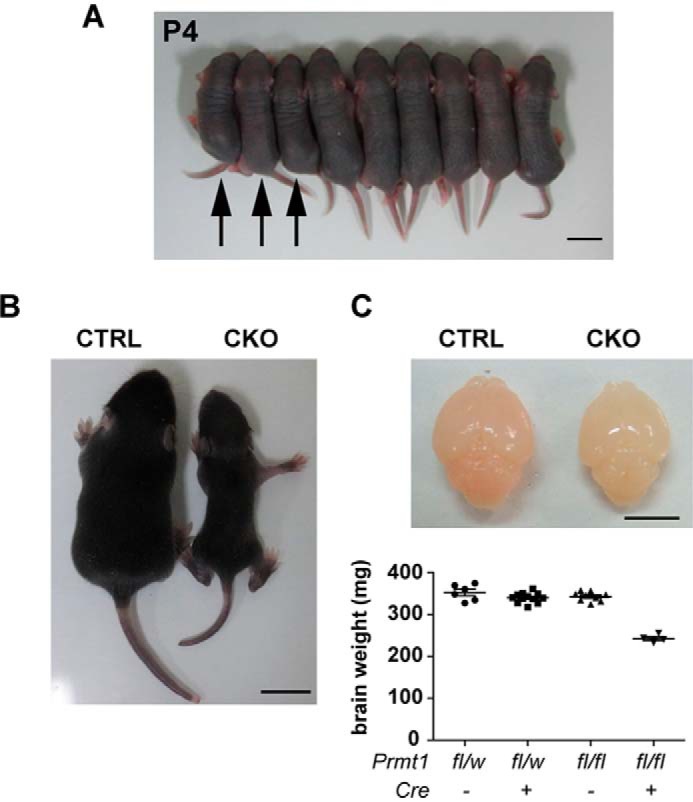
Growth retardation in Prmt1flox/flox; Nes-Cre mice. A, photograph of representative CKO mice and other littermate controls at P4. The left three pups (arrows) are confirmed to be Prmt1flox/flox; Nes-Cre by PCR analysis and smaller than other littermates. Other control littermates include Prmt1flox/flox and Prmt1flox/wt; Nes-Cre mice. Scale bar represents 1 cm. B, representative example of body sizes of CTRL and CKO mice at P10. Scale bar represents 1 cm. C, the upper panel shows the representative brain size, and the lower graph shows the fresh brain weights from littermate controls at P10. Scale bar represents 5 mm. The points in the graph show individual data sets from each animal with lines and error bars indicating mean ± S.E. n = 4–12 per each genotype.