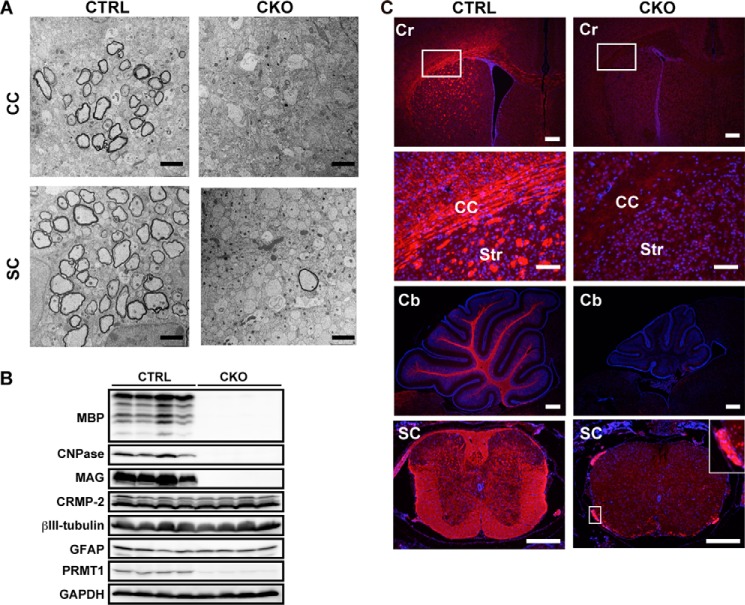
FIGURE 5.
Severe hypomyelination and dramatic decrease of mature oligodendrocytes in Prmt1flox/flox; Nes-Cre mice. A, representative electron micrograph images of corpus callosum (CC) and spinal cord (SC) of CTRL and CKO mice at P10. B, Western blot of MBP, CNPase, MAG, CRMP-2, βIII-tubulin, glial fibrillary acidic protein (GFAP), and PRMT1 expression in the brain of CTRL and CKO mice at P10. C, immunostaining images of MBP (red) with nuclear counterstain Hoechst (blue) in the cerebrum (Cr), cerebellum (Cb), and spinal cord (SC) of CTRL and CKO mice at P10. The white boxed region from the Cr panels is magnified in the CC panels. The white boxed region from the SC panels is magnified and shown in the inset (right side). Scale bars represent 2 μm in A; 300 μm in cerebrum, cerebellum, and spinal cord in C; and 100 μm in magnified images of corpus callosum in C. Str, striatum.

