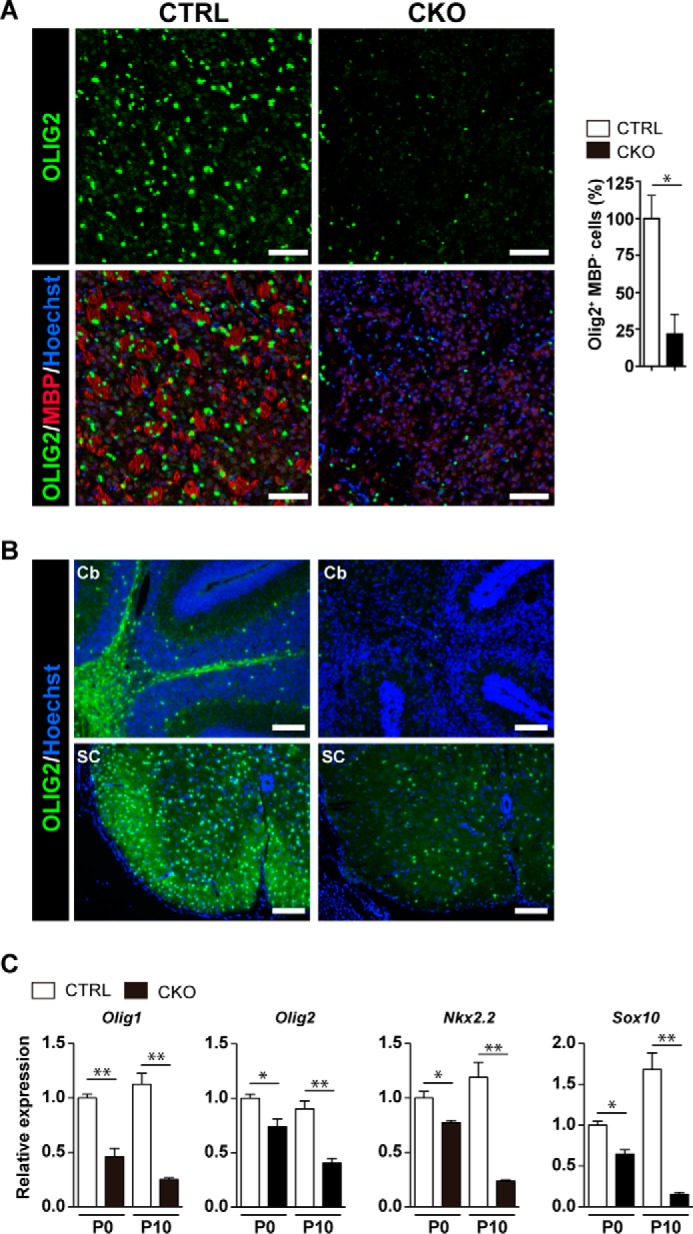
FIGURE 6.

Oligodendrocyte lineage cells were reduced in Prmt1flox/flox; Nes-Cre mice. A, immunostaining of OLIG2 (green) and MBP (red) with nuclear counterstain Hoechst (blue) in the striatum of CTRL and CKO mice at P10. The graph on the right shows the quantification of the number of OLIG2+MBP− cells in the striatum. Numbers represent the average of three sections per each genotype from a single experiment. The data shown are mean ± S.E. and analyzed by a two-tailed Student's t test. n = 3 per each genotype. *, p < 0.05 B, immunostaining of OLIG2 (green) with nuclear counterstain Hoechst (blue) in the cerebellum (Cb) and the spinal cord (SC) of CTRL and CKO mice at P10. C, relative gene expression of Olig1, Olig2, Nkx2.2, and Sox10 in the brain of CTRL and CKO mice at P0 and P10 as determined by quantitative RT-PCR. All data were normalized to Gapdh. All data shown are mean ± S.E. and were analyzed by a two-tailed Student's t test. n = 4 per each genotype.*, p < 0.05, **, p < 0.01 Scale bars represent 100 μm.
