
FIGURE 10.
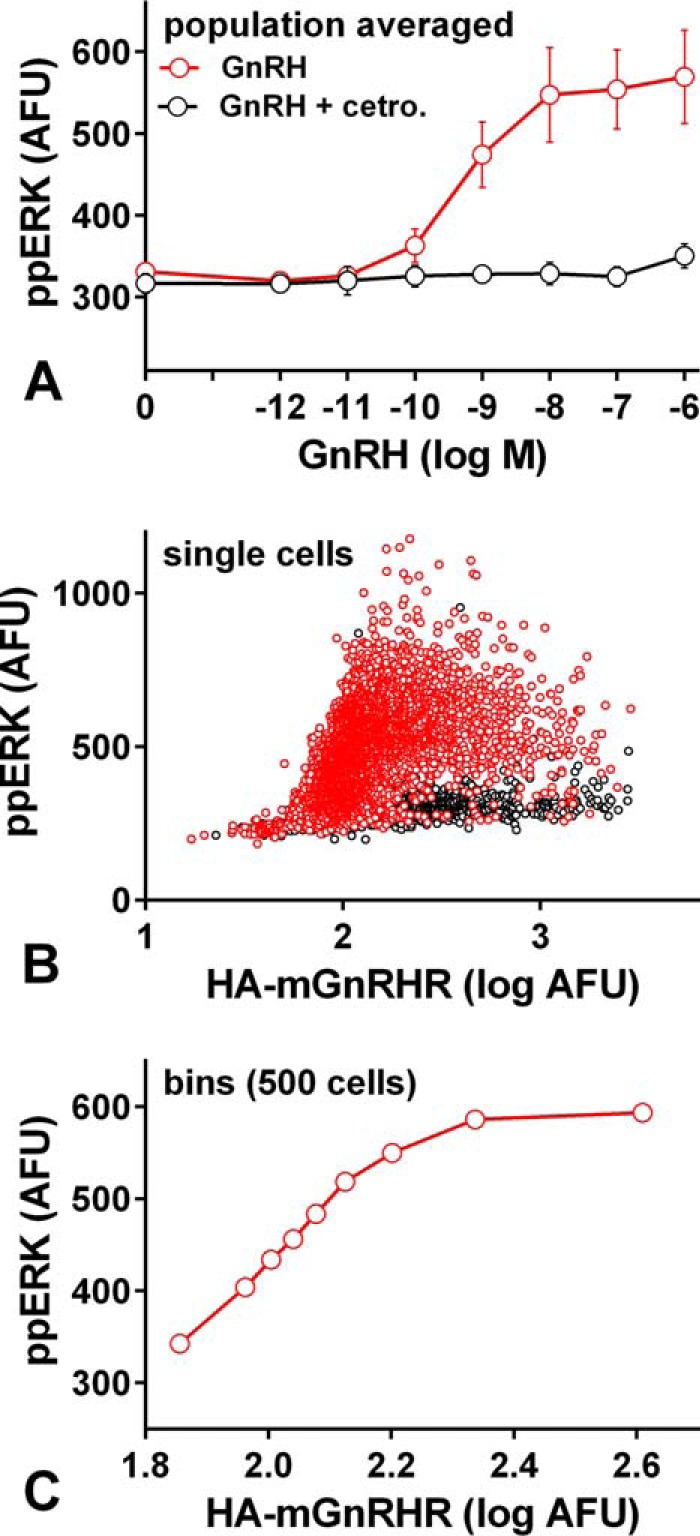
Quantifying MI between HA-tagged mGnRHR expression and ppERK. Panel A, cells grown in 6-well plates were infected with Ad for HA-tagged mGnRHR, at 3 titers (1, 10 and 100 pfu/nl). After 6 h they were pooled and transferred into 96-well plates for overnight culture. They were then stimulated 5 min with indicated GnRH concentration with or without 10−7 m Cetrorelix (as indicated) before being fixed, stained, imaged, and analyzed for nuclear ppERK and whole cell HA. Data shown are the population-averaged ppERK values pooled from three experiments. Panel B shows single cell data (nuclear ppERK plotted against log10 HA) from one such experiment and only for cells stimulated with 10−7 m GnRH without (red circles) or with (black circles) 10−7 m Cetrorelix. The 10−7 m GnRH-stimulated cells were also ranked and sorted into bins of 500 cells with increasing HA. Panel C shows ppERK plotted against HA for each of these bins (means ± S.E., n = 500 cells). Note that increasing GnRH concentration increases the ppERK response at fixed receptor number (panel A) and that increasing receptor number increases ppERK at fixed GnRH concentration (panel C). MI can then be calculated for both of these input-output pairs as shown in Fig. 9, F and G.