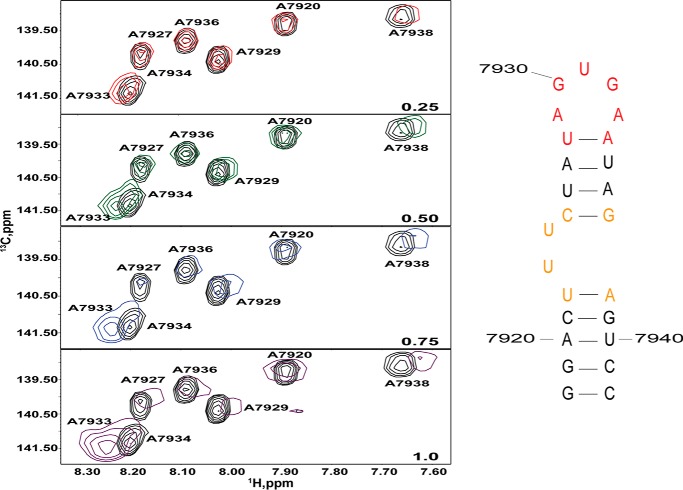
FIGURE 9.
NMR detection of the UP1-SL1ISS binding interface. 1H-13C TROSY HSQC titrations (310 K and 900 MHz) were performed by titrating unlabeled UP1 into a [13C]A-selectively labeled SL1ISS-25 construct. Spectral plots correspond to the C8-H8 region for each titration point as indicated by the molar ratio (lower right). Addition of UP1 leads to significant chemical shift perturbations of apical loop adenosines (7933 and 7934) and A7938.

