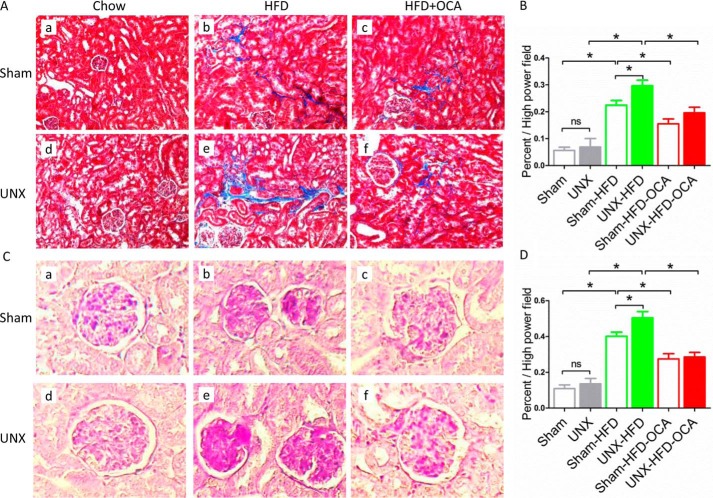
FIGURE 3.
Effects of FXR activation on glomerular and tubulointerstitial injury. Representative images of Masson's trichrome-stained (A) and PAS-stained (C) sections of kidney tissue from the six treatment groups. n = 6 mice/group. B and D, bars represent the quantitative analysis of the area of fibrosis (B) and the mesangial area (D). n = 6 mice/group. Data are expressed as mean ± S.E. One-way ANOVA with Bonferroni's test. *, p < 0.05.

