
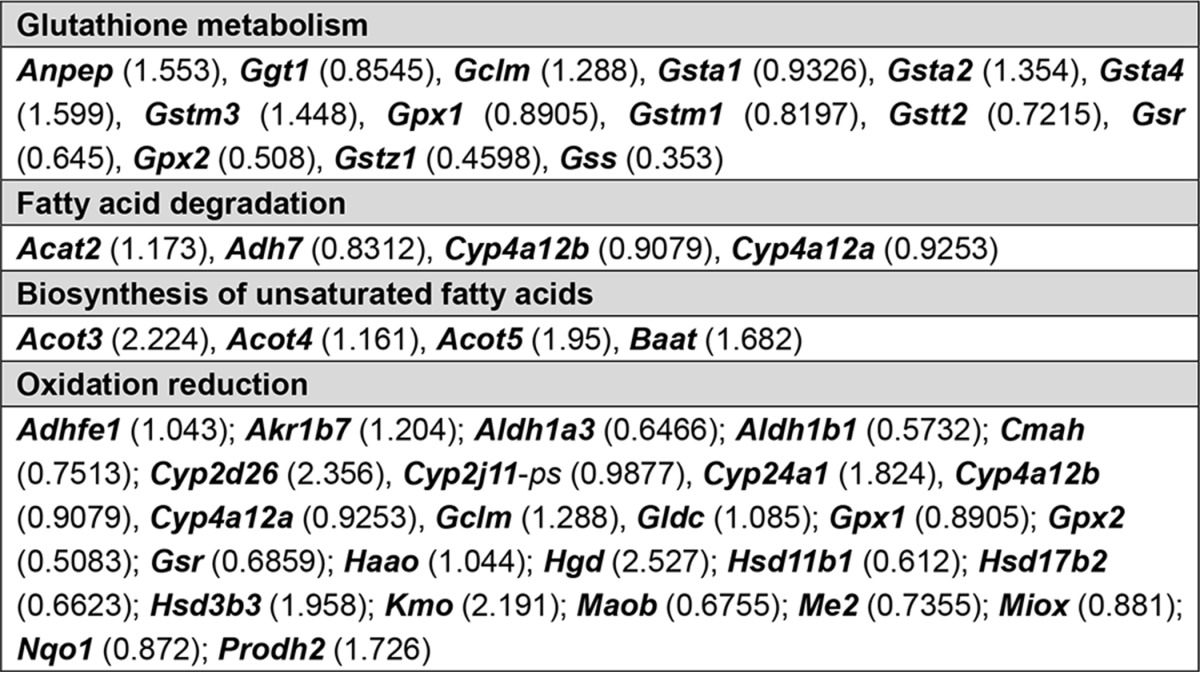
TABLE 3.
Selected differentially expressed genes in GW4064-treated versus untreated proximal tubular cells grouped according to function
Numbers in parentheses indicate gene expression levels quantified as Log2 of fold changes.
Official websites use .gov
A
.gov website belongs to an official
government organization in the United States.
Secure .gov websites use HTTPS
A lock (
) or https:// means you've safely
connected to the .gov website. Share sensitive
information only on official, secure websites.
Selected differentially expressed genes in GW4064-treated versus untreated proximal tubular cells grouped according to function
Numbers in parentheses indicate gene expression levels quantified as Log2 of fold changes.