
FIGURE 3.
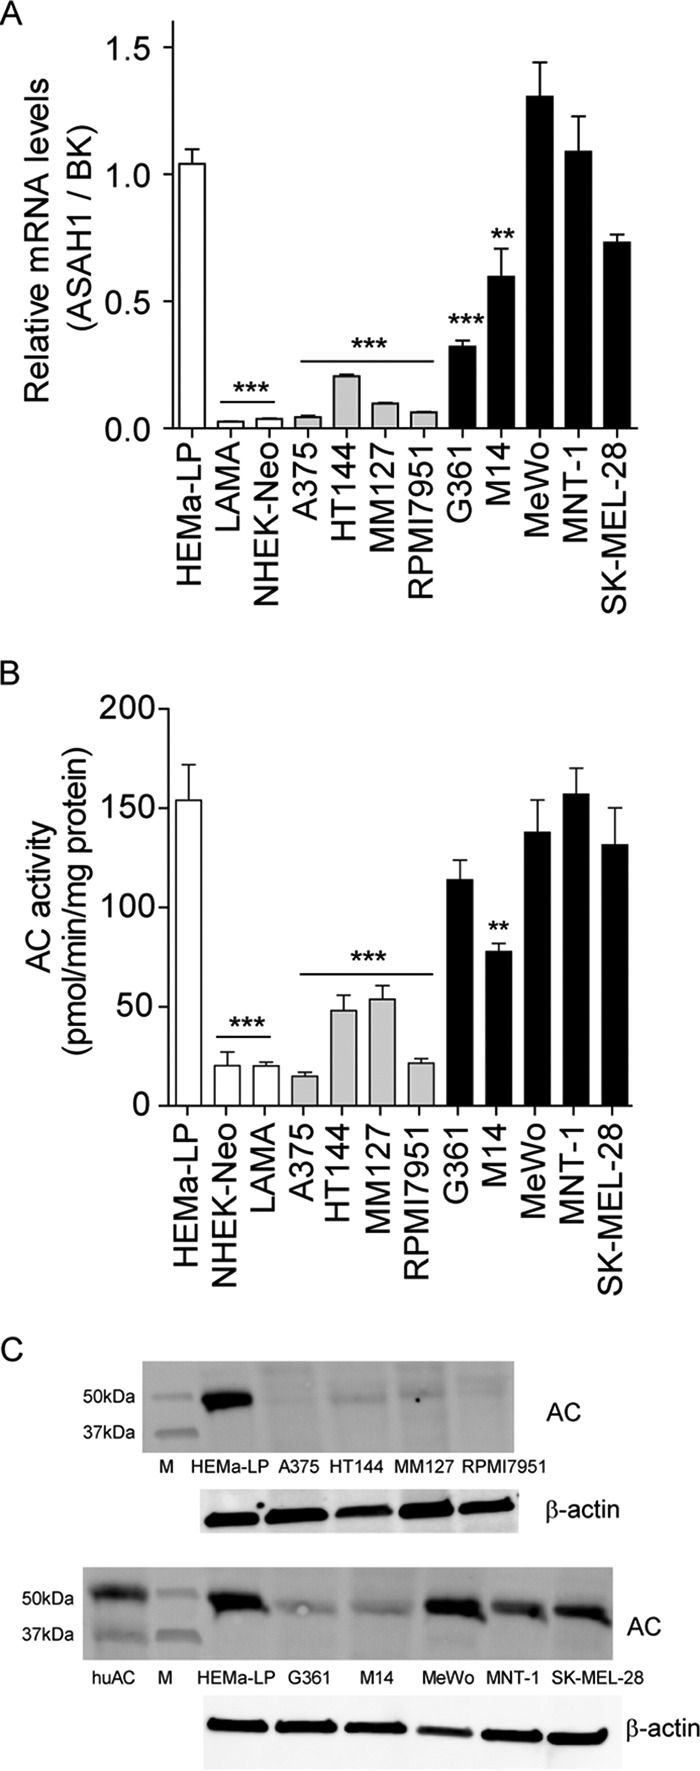
AC expression in melanocytes and other human cells in cultures. A–C, AC (ASAH1) mRNA levels (A), enzymatic activity (B), and immunoblotting (C). Values are reported as the mean ± S.E. (error bars) of 6–10 determinations from two independent experiments. **, p < 0.01; ***, p < 0.001 versus HEMa-LP; one-way ANOVA followed by Dunnett's test. Gene expression data are reported as -fold induction versus HEMa-LP. BK, BestKeeper gene, geometric mean of four different housekeeping genes.