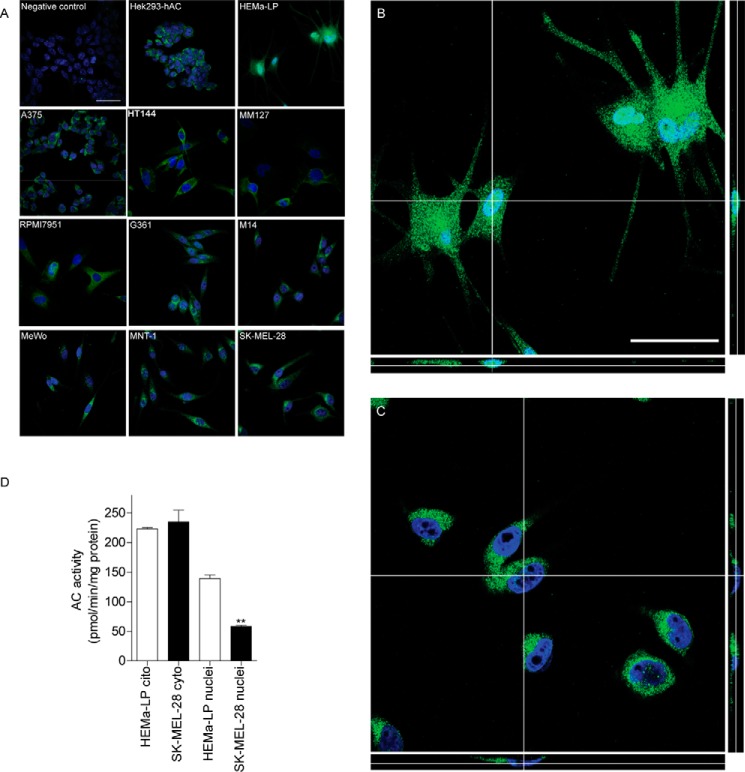
FIGURE 4.
AC localization in HEMa-LP and SKMel28 cells. A, selected z-scanning series of images showing immunofluorescence for AC (green) or DAPI (blue) in melanoma and normal melanocytes. Scale bar, 50 μm. Right panels, high magnification orthogonal views (yx plane, yz plane, and xz plane) of AC (green) and DAPI (blue) staining in normal melanocytes (B) or SK-MEL-28 cells (C). Scale bar, 50 μm. D, AC enzymatic activity in cytosolic and nuclear extracts from HEMa-LP and SK-MEL-28 cells. Values are reported as the mean ± S.E. (error bars) of 6–10 determinations from two independent experiments. **, p < 0.01 versus HEMa-LP, Student's t test.

