
FIGURE 6.
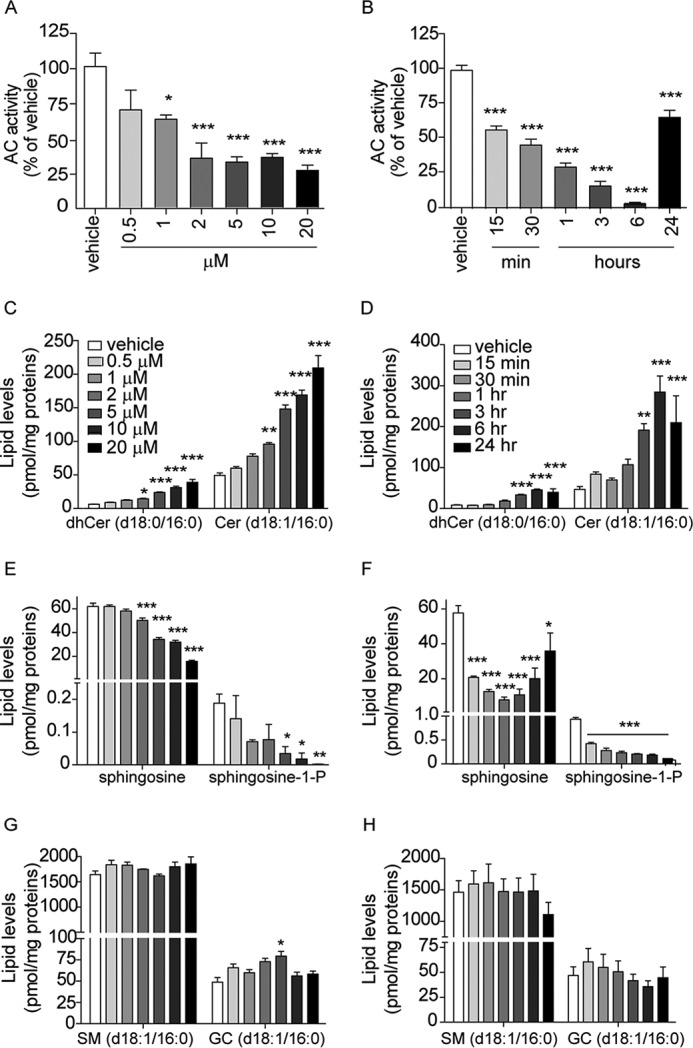
Effects of ARN14988 on AC activity and sphingolipid levels in A375 cells. Concentration dependence (3-h incubation; left panels) and time course (20 μm; right panels) of ARN14988 or vehicle (0.4% DMSO; open bars). Shown are AC activity (A and B) and sphingolipid levels (C–H). Values are reported as the mean ± S.E. (error bars) of 3–6 determinations. Independent experiments yielded similar results. *, p < 0.05; **, p < 0.01; ***, p < 0.001 versus vehicle; one-way ANOVA followed by Dunnett's test.