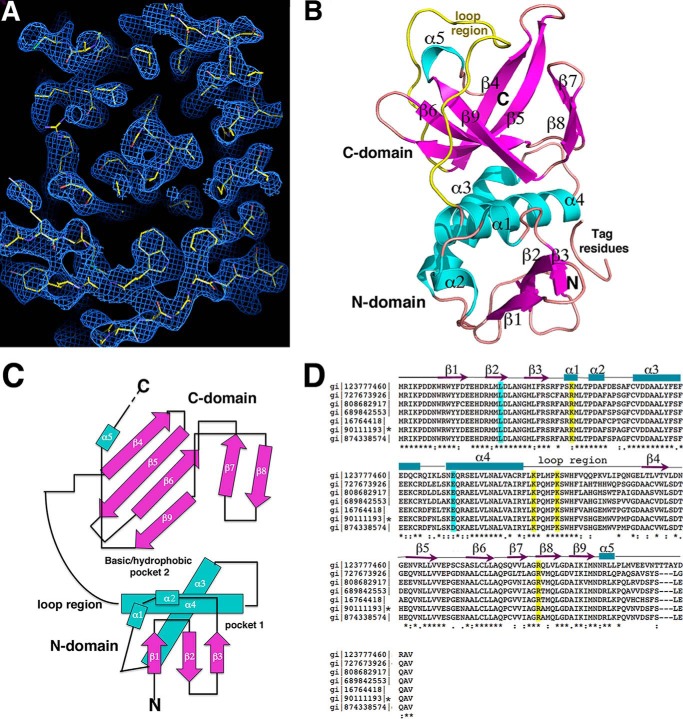
FIGURE 1.
Crystal structure of E. coli ZapC. A, experimental MAD electron density map (blue mesh) contoured at 1.0 σ and calculated to 2.4 Å with the final model included (yellow sticks). B, ribbon diagram of the ZapC structure. Secondary structural elements are labeled and colored magenta for β-strands and cyan for α-helices. Also labeled are the domains and the long loop region (yellow). This figure and Fig. 2A, Fig. 3, A–D, and Fig. 8 were generated using PyMOL. C, topology diagram of ZapC with β-strands shown as arrows and colored magenta, as in B, α-helices are colored cyan and shown as rods. D, sequence alignment of selected ZapC proteins. Highlighted in cyan are residues previously shown to be important in ZapC function (21) and in yellow, the basic residues that line the C-domain pocket that were analyzed for their affects on FtsZ binding and bundling. Identical/always conserved, highly similar/conserved, and semi-conserved residues are indicated by asterisks, double dots, and dots, respectively, under the alignment. Also shown over the sequence are the secondary structural elements obtained from the structure. The sequences denote the following bacteria: gi 123777460 sp Q7CHK5.1 Yersinia pestis; gi 727673926 gb KHF69007.1 Klebsiella pneumonia; gi 808682917 emb CQR76953.1 Enterobacter cloacae; gi 689842553 dbj GAL42017.1 Citrobacter freundii NBRC; gi 16764418 ref NP_460033.1 Salmonella enterica subsp. enterica serovar typhimurium str. LT2; gi 90111193 ref NP_415466.4 E. coli str. K-12 substr. MG1655, gi 874338574 emb CEP58367.1 Shigella flexneri 2a. An asterisk denotes the E. coli sequence.

